Deadband Hysteresis Supertrend [BackQuant]Deadband Hysteresis Supertrend
A two-stage trend tool that first filters price with a deadband baseline, then runs a Supertrend around that baseline with optional flip hysteresis and ATR-based adverse exits.
What this is
A hybrid of two ideas:
Deadband Hysteresis Baseline that only advances when price pulls far enough from the baseline to matter. This suppresses micro noise and gives you a stable centerline.
Supertrend bands wrapped around that baseline instead of raw price. Flips are further gated by an extra margin so side changes are more deliberate.
The goal is fewer whipsaws in chop and clearer regime identification during trends.
How it works (high level)
Deadband step — compute a per-bar “deadband” size from one of four modes: ATR, Percent of price, Ticks, or Points. If price deviates from the baseline by more than this amount, move the baseline forward by a fraction of the excess. If not, hold the line.
Centered Supertrend — build upper and lower bands around the baseline using ATR and a user factor. Track the usual trailing logic that tightens a band while price moves in its favor.
Flip hysteresis — require price to exceed the active band by an extra flip offset × ATR before switching sides. This adds stickiness at the boundary.
Adverse exit — once a side is taken, trigger an exit if price moves against the entry by K × ATR .
If you would like to check out the filter by itself:
What it plots
DBHF baseline (optional) as a smooth centerline.
DBHF Supertrend as the active trailing band.
Candle coloring by trend side for quick read.
Signal markers 𝕃 and 𝕊 at flips plus ✖ on adverse exits.
Inputs that matter
Price Source — series being filtered. Close is typical. HL2 or HLC3 can be steadier.
Deadband mode — ATR, Percent, Ticks, or Points. This defines the “it’s big enough to matter” zone.
ATR Length / Mult (DBHF) — only used when mode = ATR. Larger values widen the do-nothing zone.
Percent / Ticks / Points — alternatives to ATR; pick what fits your market’s convention.
Enter Mult — scales the deadband you must clear before the baseline moves. Increase to filter more noise.
Response — fraction of the excess applied to baseline movement. Higher responds faster; lower is smoother.
Supertrend ATR Period & Factor — traditional band size controls; higher factor widens and flips less often.
Flip Offset ATR — extra ATR buffer required to flip. Useful in choppy regimes.
Adverse Stop K·ATR — per-trade danger brake that forces an exit if price moves K×ATR against entry.
UI — toggle baseline, supertrend, signals, and bar painting; choose long and short colors.
How to read it
Green regime — candles painted long and the Supertrend running below price. Pullbacks toward the baseline that fail to breach the opposite band often resume higher.
Red regime — candles painted short and the Supertrend running above price. Rallies that cannot reclaim the band may roll over.
Frequent side swaps — reduce sensitivity by increasing Enter Mult, using ATR mode, raising the Supertrend factor, or adding Flip Offset ATR.
Use cases
Bias filter — allow entries only in the direction of the current side. Use your preferred triggers inside that bias.
Trailing logic — treat the active band as a dynamic stop. If the side flips or an adverse K·ATR exit prints, reduce or close exposure.
Regime map — on higher timeframes, the combination baseline + band produces a clean up vs down template for allocation decisions.
Tuning guidance
Fast markets — ATR deadband, modest Enter Mult (0.8–1.2), response 0.2–0.35, Supertrend factor 1.7–2.2, small Flip Offset (0.2–0.5 ATR).
Choppy ranges — widen deadband or raise Enter Mult, lower response, and add more Flip Offset so flips require stronger evidence.
Slow trends — longer ATR periods and higher Supertrend factor to keep you on side longer; use a conservative adverse K.
Included alerts
DBHF ST Long — side flips to long.
DBHF ST Short — side flips to short.
Adverse Exit Long / Short — K·ATR stop triggers against the current side.
Strengths
Deadbanded baseline reduces micro whipsaws before Supertrend logic even begins.
Flip hysteresis adds a second layer of confirmation at the boundary.
Optional adverse ATR stop provides a uniform risk cut across assets and regimes.
Clear visuals and minimal parameters to adjust for symbol behavior.
Putting it together
Think of this tool as two decisions layered into one view. The deadband baseline answers “does this move even count,” then the Supertrend wrapped around that baseline answers “if it counts, which side should I be on and where do I flip.” When both parts agree you tend to stay on the correct side of a trend for longer, and when they disagree you get an early warning that conditions are changing.
When the baseline bends and price cannot reclaim the opposite band , momentum is usually continuing. Pullbacks into the baseline that stall before the far band often resolve in trend.
When the baseline flattens and the bands compress , expect indecision. Use the Flip Offset ATR to avoid reacting to the first feint. Wait for a clean band breach with follow through.
When an adverse K·ATR exit prints while the side has not flipped , treat it as a risk event rather than a full regime change. Many users cut size, re-enter only if the side reasserts, and let the next flip confirm a new trend.
Final thoughts
Deadband Hysteresis Supertrend is best read as a regime lens. The baseline defines your tolerance for noise, the bands define your trailing structure, and the flip offset plus adverse ATR stop define how forgiving or strict you want to be at the boundary. On strong trends it helps you hold through shallow shakeouts. In choppy conditions it encourages patience until price does something meaningful. Start with settings that reflect the cadence of your market, observe how often flips occur, then nudge the deadband and flip offset until the tool spends most of its time describing the move you care about rather than the noise in between.
ATR

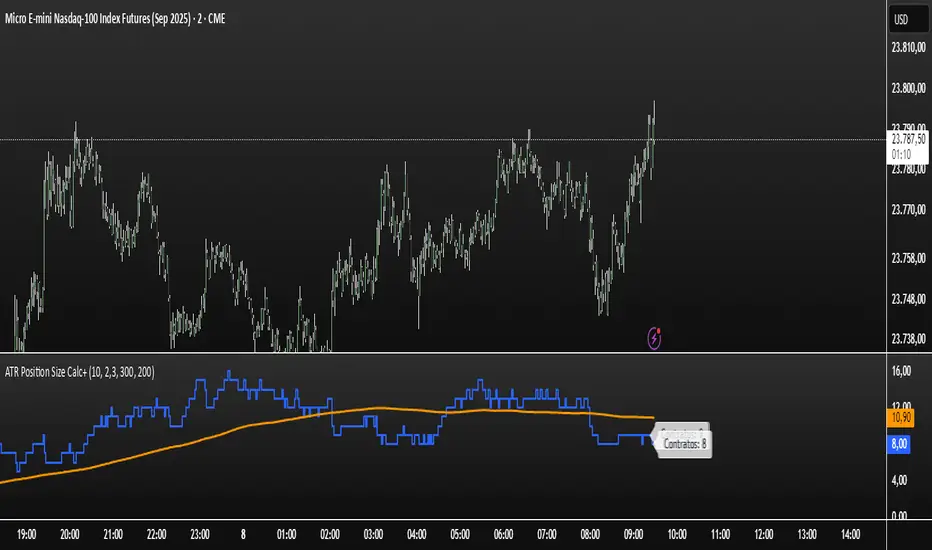
ATR Position Size Calc+Stop guessing your position size. This indicator automatically calculates the optimal number of contracts or shares for each trade.
It is designed for one purpose: to help you maintain consistent risk management by adjusting your trade size based on current market volatility (ATR) and your fixed monetary risk.
// KEY FEATURES
Consistent Risk : Set your max risk in dollars (e.g., $300), and the script calculates the exact position size to match it.
Volatility-Based Stops : Uses the ATR to define a logical stop loss that adapts to market conditions.
Stable Calculation : The calculation is based on the previous closed candle, so the value is reliable and doesn't change intra-bar.
// HOW TO USE
In the settings, simply define your max risk per trade ($) and your ATR parameters. The indicator does the rest.
The essential tool for disciplined trading.
ATR Take Profit (T-Maker)A dead-simple take-profit helper based on ATR.
This script calculates a 14-period Average True Range (ATR) and multiplies it by a user-defined factor, then shows that single number on your chart in a small table (bottom-left). Use it as a quick, volatility-aware distance for setting take-profit levels, scaling out, or gauging whether a move has “room” to breathe.
What it does
Computes ATR(14) × Multiplier every bar.
Displays the result (rounded to 2 decimals) in a clean on-chart label.
Updates only on the last bar to avoid visual noise and keep performance snappy.
Why it’s useful
Volatility-adjusted targets: ATR adapts to changing market conditions, so your TP distance scales with current volatility.
Instrument & timeframe agnostic: Works on any symbol and timeframe supported by TradingView.
Minimalist workflow: No lines or clutter—just the exact distance to add/subtract from your entry.
How to use it
Choose your ATR Multiplier (default = 4).
Example: If ATR(14) = 1.52 and Multiplier = 4 → displayed value = 6.08.
For a long, a simple TP idea is: TP = Entry + xATR.
For a short: TP = Entry − xATR.
Optionally draw a manual horizontal line at your calculated TP level, or use the value to feed your own rules in other scripts.
Tip: Test different multipliers per market/timeframe (e.g., 2–3 for intraday indices, 3–5 for swing on FX/crypto). Optimize in backtests before going live.
Inputs
ATR Multiplier (int): Scales ATR(14) to your preferred TP distance.
Text Color (color): Customize the display color to match your theme.
Notes & Limitations
Uses ATR(14) (fixed) for consistency in this original version.
Displays a single number only—it does not plot levels, draw lines, or place orders.
Value is rounded to 2 decimals and shown bottom-left of the chart.
Version
v1.0 — Original release (minimal, display-only utility)
Created by T-Maker. This tool is for educational purposes only and is not financial advice. Always manage risk and verify settings before trading.
Zone Cluster Confluence ProWhat it does
Zone Cluster Confluence Pro automatically finds price “zones” via equal-frequency clustering of HLC3 values and wraps each cluster center with an ATR-based band. Zones are color-coded by a 0–100 Strength % and can optionally highlight confluence with a higher timeframe (HTF) right on your chart.
Key features
• Adaptive Depth by Volatility (ATR regime): zone width scales down in calm markets and widens in volatile regimes.
• Strength % scoring with color mapping (Strong / Work / Mid / Weak). The score blends:
• number of touches (with tolerance),
• dwell time inside the zone (penalized),
• confirmed breakouts (penalized),
• average overshoot beyond the band (penalized),
• recency bonus,
• optional volume-boosted touches (volume > SMA × multiplier).
• HTF Confluence Overlay: computes zones on a higher TF (multiplier of the source TF or a specific TF) and highlights the intersection of LTF zones with the nearest HTF zone (white fill).
• Presets per TF: Aggressive / Stable / Anti-pierce profiles with hand-tuned params for 15/30/60/120/240m; or run fully Manual.
• Clean visuals: centers, borders, filled bands; strength labels with auto-contrast text.
How it works (high level)
• Clustering method: choose K-median or K-means (median/mean of equal-frequency buckets) to place zone centers.
• Zone width = ATR × Depth; Depth becomes Adaptive when the ATR regime deviates from its long SMA.
• Strength % is computed over a lookback window using the components listed above; touches can earn an extra bonus on elevated volume.
Inputs (most useful)
• Source TF: inherit from chart or pick a specific TF.
• Zones (k): 2–5 clusters.
• Presets: Aggressive / Stable / Anti-pierce, or Manual control of Candles Back, ATR length, Depth.
• Adaptive Depth: on/off, regime thresholds & multipliers.
• Strength %: profile (Conservative/Neutral/Optimistic), lookback, breakout/overshoot/touch tolerance.
• Volume boost: SMA length, spike multiplier, weight.
• HTF Confluence: on/off, TF multiplier, HTF preset/method/params, and whether HTF k mirrors LTF k.
Reading the chart
• Zone fills are colored by Strength %:
• 80–100 Strong, 60–80 Work, 40–60 Mid, <40 Weak.
• White fills mark LTF×HTF intersections (confluence areas).
• Strength labels (Z1…Z5) show the current score; label background matches the strength color.
Tips
• Use Stable for most markets, Aggressive for fast intraday, Anti-pierce to reduce whipsaw.
• Turn on HTF confluence to filter LTF zones down to areas aligned with the larger trend structure.
• If you scalp, keep volume boost on; for thin markets consider lowering the spike multiplier.
Notes
• No lookahead is used for HTF data (request.security with lookahead_off).
• Zones update as new bars arrive and as the lookback window rolls; this is not a fixed S/R drawing tool.
• Works on any symbol/timeframe; parameter tuning is encouraged.
Access
This script is Invite-Only.
Disclaimer
For educational purposes only. Not financial advice. Trading involves risk.

TRADIVEX_ATR TablosuBINANCE:BTCUSDT.P tr.tradingview.com ## **TRADIVEX\_ATR Table – Indicator Description**
**Overview:**
The TRADIVEX\_ATR Table is a versatile trading tool that provides a concise, visual overview of market volatility, price direction, and ATR-based support/resistance levels. Designed for traders seeking quick insights, this indicator combines key metrics into a color-coded table directly on the chart.
**Key Features:**
* **ATR Calculation & Dynamic Bands:**
Measures Average True Range (ATR) over a configurable period and calculates upper and lower price bands using a multiplier. These bands act as dynamic support and resistance levels, adapting automatically to market volatility.
* **Volatility Assessment:**
Displays market volatility as a percentage of the current price. Volatility is classified into **High, Medium, or Low**, with intuitive color coding:
* High → Red
* Medium → Orange
* Low → Green
* **Price Direction:**
Tracks the direction of the current price relative to the previous bar:
* Up → Green
* Down → Red
* Neutral → Gray
* **Information Table:**
Shows all relevant metrics in a structured table overlay, including:
1. ATR Length (period)
2. ATR Multiplier
3. Upper Band Level
4. Lower Band Level
5. Current Price
6. High Price
7. Low Price
8. ATR Value
9. Volatility Level (color-coded)
10. Price Direction (color-coded)
* **Customizable Table Position:**
The table can be positioned anywhere on the chart (top, middle, bottom, left, right, or center), ensuring it doesn’t obstruct your price action analysis.
**Usage & Benefits:**
* Quickly assess market volatility and momentum.
* Identify short-term trends and directional bias.
* Monitor dynamic ATR-based support/resistance levels.
* Make informed decisions for entries, exits, and stop-loss placements.
**Ideal For:**
Traders who want a **real-time, visual summary of market conditions** without cluttering the chart with multiple indicators.
---

𝑨𝒔𝒕𝒂𝒓 - HelAstar – Hel is an adaptive ATR stop system that finds the best ATR length in real time.
@v1.0
Optimizes ATR length automatically within a defined range
Plots dynamic long/short stops with ATR multiplier
Option to use Super Smoother (FFT-lite) filtering
On-chart stats table with performance & win probability
Lightweight, efficient, and no repainting

Smart Money Price Action ProSmart Money Price Action Pro - Smart Money and Price Action Dynamic Toolkit
The Smart Money Price Action Pro is designed to bring together multiple layers of market analysis into a single, cohesive framework, combining trend identification and consolidation detection in an actionable format. While individual indicators can provide useful insights, they often work in isolation. This toolkit integrates market flow detection, range analytics, and adaptive visualization into one system, allowing traders to see the bigger picture without piecing together multiple disconnected tools.
Building on principles from institutional trading behaviors, the toolkit gives traders a clearer picture of where “smart money” may be entering or exiting the market. Its design emphasizes confluence: signals from multiple independent modules overlap to create higher conviction setups, offering a structured edge when planning entries, exits, and risk levels.
At its core, the toolkit addresses the duality of market conditions: trending versus ranging. By offering a combination of trend-following signals and contrarian insights, it helps traders operate with a deeper understanding of market structure. While it provides actionable signals and visual guidance, it is intended as an assistive system, helping traders make more informed decisions rather than serving as a single source of truth.
Key Modules
1. Smart Money Signal Module
The Smart Money Signal Module identifies potential institutional activity by analyzing price swings and momentum shifts. Using configurable swing detection, it highlights potential reversal or continuation zones, expressed as adaptive zones around key market levels.
Signals are augmented with trend-colored candle overlays, offering immediate guidance on market bias. Bullish and bearish zones are clearly marked, while continuation and reversal markers help distinguish between trend shifts and market noise.
At its core, the engine applies swing detection combined with a sensitivity filter to track directional momentum across recent bars. This allows it to pinpoint bullish pivots (where downside momentum fades and strength returns) and bearish pivots (where upside momentum collapses). Once a pivot is confirmed, the system draws flow lines that map the breakout and classify it as either continuation or reversal, depending on broader market bias.
Momentum zones are then plotted to show areas where buyers stepped in with strength or sellers forced price lower. These levels extend forward dynamically, shifting in real time as new data forms. Zones change color the moment they break, visually confirming whether market structure has held or failed. Gradient shading highlights periods of extreme pressure, giving traders a clear visual of when momentum surges into overbought or oversold territory.
Instead of simply showing trend direction, this module also maps accumulation and distribution zones tied to institutional flows. When combined with the Range Module, these zones become more meaningful — for example, when institutional accumulation aligns with a breakout from consolidation.
Practical Use: Traders can use these signals to align trades with institutional flows. For example, entering a long position near a bullish accumulation zone or managing risk when bearish distribution areas form. By combining these insights with higher timeframe analysis, traders can filter out false signals and improve decision-making.
2. Range Detection Module
The Range Detection engine continuously monitors price action to flag when markets transition into consolidation phases. Ranges are defined not just by flat price action, but by a measurable contraction in volatility, repeated touches of boundary levels, and the clustering of traded volume around a central equilibrium point.
Once a valid range is identified, the system assigns a compression strength score (0–100). This score reflects how cleanly defined and structurally sound the consolidation is—higher scores indicate tighter boundaries and stronger evidence of accumulation or distribution.
Breakout tendencies are modeled dynamically. The system updates a forward-looking bias by incorporating:
Boundary time distribution – how often price presses against upper vs. lower edges
Historical breakout patterns – probability benchmarks derived from structurally similar ranges
Volume skew – whether traded volume leans toward buyers or sellers inside the range
Momentum alignment – auxiliary filters such as slope-based oscillators that indicate when energy is building for a directional move
The result is a live breakout forecast that evolves bar by bar as the range matures. Each active range carries a visual strength meter plotted above the consolidation zone, quantifying both compression and breakout potential in real time.
The module also supports range memory, preserving completed consolidations even after a breakout. This allows traders to review the prior structure for post-analysis or to track whether price respects the boundaries of the old range as support or resistance going forward.
Practical Use : Traders can use these ranges to anticipate breakout direction or step aside when conditions are unclear. A tight consolidation near a bullish zone, for instance, often signals a potential long opportunity, while overlapping bearish flows warn of false breakouts.
Integrated Workflow
The strength of the toolkit lies in its synergy. Each module is effective on its own, but the real advantage comes when their signals align.
A typical workflow may include:
Assessing the market trend using the Smart Money Signal Module and its trend-colored overlays
Identifying consolidation and breakout zones with the Range Detection Module
Watching for confluences: institutional accumulation aligning with range compression, or dashboard bias matching local setups
Executing trades with structured confidence, using these layered confirmations rather than relying on a single trigger
This integrated workflow streamlines decision-making and avoids the conflicting signals that can occur when combining unrelated indicators.
Additional Features
Adaptive Visualization : Dynamic zones and trend overlays adjust to volatility, keeping charts clear and focused
Analytics Dashboard : A compact summary panel shows active zones, bullish vs bearish flow counts, and current bias, giving context at a glance
Instead of simply adding more signals, the dashboard provides a meta-layer of analysis — context, bias, and flow strength — helping traders manage risk and stay aligned with broader market conditions.
Use Cases
Trend Confluence : Entering trades in line with prevailing smart money flows while filtering out counter-trend setups
Breakout Trading : Using the Range Detection Module to anticipate breakout zones and confirming direction with institutional flow signals
Contrarian Reversal Trades : Targeting accumulation/distribution zones where both modules indicate potential reversals
Each use case demonstrates how layered confluence creates clarity and conviction, making the toolkit a strong complement to other forms of technical analysis.
Conclusion
The Smart Money Signals Toolkit simplifies complex market analysis into actionable, visually intuitive insights. While standalone indicators provide value, this toolkit goes further by combining smart money flows, range detection, adaptive zones, and dashboard analytics into one cohesive system.
It doesn’t just generate buy/sell markers — it shows why a setup matters, where it is occurring, and how it aligns with broader conditions. This allows traders to operate with greater clarity, structure, and discipline.
Risk Disclaimer : This toolkit and its features are for educational and informational purposes only. Past performance does not guarantee future results. All suggested use cases are theoretical and should be applied with proper risk management.

2ATR / Close %Certainly. Here is the English version of the indicator description you requested.
---
### **2ATR Stop-Loss Ratio**
This indicator provides a straightforward calculation of **what percentage a 2ATR (Average True Range) move represents relative to the current price**. It's a specialized tool designed to help traders set dynamic, volatility-based stop-loss levels.
---
### **Purpose of the Indicator**
Many traders use a **2ATR** as their standard for setting a stop-loss, believing it's a good measure of a stock's typical movement. However, it can be difficult to quickly determine the exact percentage a 2ATR drop represents from the current price. This indicator solves that problem by giving you a clear, single number that shows the **anticipated percentage loss before you even enter a position**.
---
### **How It Works**
The indicator is calculated using a simple formula:
**(2 * ATR(20) / Current Price) * 100**
* `ATR(20)`: The Average True Range over the last 20 periods. This period can be customized in the indicator's settings.
* `Current Price`: The closing price at the time of calculation.
---
### **How to Use It**
* **Assess Risk**: A higher number on the indicator means greater volatility, indicating a wider stop-loss range.
* **Set a Stop-Loss**: If the indicator shows **3%**, it means a 2ATR move is roughly a 3% change from the current price. This gives you a clear understanding of the potential loss.
* **Adjust Position Size**: If the potential percentage loss is larger than you're comfortable with, you can use this information to reduce your position size, effectively managing your risk.
This tool is especially useful for trading highly volatile stocks, as it helps you establish a clear and effective risk management strategy.

NY Anchored VWAP and Auto SMANY Anchored VWAP and Auto SMA
This script is a versatile trading indicator for the TradingView platform that combines two powerful components: a New York-anchored Volume-Weighted Average Price (VWAP) and a dynamic Simple Moving Average (SMA). Designed for traders who utilize VWAP for intraday trend analysis, this tool provides a clear visual representation of average price and volatility-adjusted moving averages, generating automated alerts for key crossover signals.
Indicator Components
1. NY Anchored VWAP
The VWAP is a crucial tool that represents the average price of a security adjusted for volume. This version is "anchored" to the start of the New York trading session, resetting at the beginning of each new session. This provides a clean, session-specific anchor point to gauge market sentiment and trend. The VWAP line changes color to reflect its slope:
Green: When the VWAP is trending upwards, indicating a bullish bias.
Red: When the VWAP is trending downwards, indicating a bearish bias.
2. Auto SMA
The Auto SMA is a moving average with a unique twist: its lookback period is not fixed. Instead, it dynamically adjusts based on market volatility. The script measures volatility using the Average True Range (ATR) and a Z-Score calculation.
When volatility is expanding, the SMA's length shortens, making it more sensitive to recent price changes.
When volatility is contracting, the SMA's length lengthens, smoothing out the price action to filter out noise.
This adaptive approach allows the SMA to react appropriately to different market conditions.
Suggested Trading Strategy
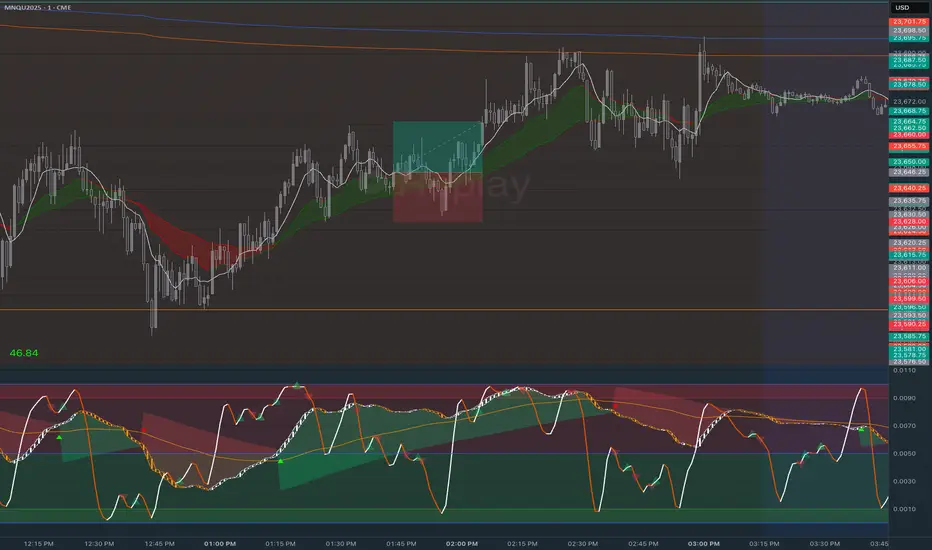
This indicator is particularly effective when used on a one-minute chart for identifying high-probability trade entries. The core of the strategy is to trade the crossover between the VWAP and the Auto SMA, with confirmation from a candle close.
The strategy works best when the entry signal aligns with the overall bias of the higher timeframe market structure. For example, if the daily or 4-hour chart is in an uptrend, you would look for bullish signals on the one-minute chart.
Bullish Entry Signal: A potential entry is signaled when the VWAP crosses above the Auto SMA, and is confirmed when the one-minute candle closes above both the VWAP and the SMA. This indicates a potential continuation of the bullish momentum.
Bearish Entry Signal: A potential entry is signaled when the VWAP crosses below the Auto SMA, and is confirmed when the one-minute candle closes below both the VWAP and the SMA. This indicates a potential continuation of the bearish momentum.
The built-in alerts for these crossovers allow you to receive notifications without having to constantly monitor the charts, ensuring you don't miss a potential setup.

Sentinel 5 — OHL daybreak signals [KedArc Quant]Overview
Sentinel 5 plots the first-bar high/low of each trading session and gives clean, rules-based signals in two ways:
1) OHL Setups at the close of the first bar (Open equals/near High for potential short; Open equals/near Low for potential long).
2) Breakout Signals later in the session when price breaks the first-bar High/Low, with optional body/penetration filters.
Basic workflow
1. Wait for the first session bar to finish.
*If O≈H (optionally by proximity) → short setup. •
*If O≈L → long setup. • If neither happens, optionally allow later breakouts.
2. Optional: Act only on breakouts that penetrate a minimum % of that bar’s range/body.
3. Skip the day automatically if the first bar is abnormally large (marubozu-like / extreme ATR / outsized vs yesterday).
Signals & Markers
Markers on the chart:
▲ O=L (exact) / O near L (proximity) – long setup at first-bar close.
▼ O=H (exact) / O near H (proximity) – short setup at first-bar close.
▲ Breakout Long – later bar breaks above first-bar High meeting your penetration rule.
▼ Breakout Short – later bar breaks below first-bar Low meeting your penetration rule.

Advanced Range Analyzer ProAdvanced Range Analyzer Pro – Adaptive Range Detection & Breakout Forecasting
Overview
Advanced Range Analyzer Pro is a comprehensive trading tool designed to help traders identify consolidations, evaluate their strength, and forecast potential breakout direction. By combining volatility-adjusted thresholds, volume distribution analysis, and historical breakout behavior, the indicator builds an adaptive framework for navigating sideways price action. Instead of treating ranges as noise, this system transforms them into opportunities for mean reversion or breakout trading.
How It Works
The indicator continuously scans price action to identify active range environments. Ranges are defined by volatility compression, repeated boundary interactions, and clustering of volume near equilibrium. Once detected, the indicator assigns a strength score (0–100), which quantifies how well-defined and compressed the consolidation is.
Breakout probabilities are then calculated by factoring in:
Relative time spent near the upper vs. lower range boundaries
Historical breakout tendencies for similar structures
Volume distribution inside the range
Momentum alignment using auxiliary filters (RSI/MACD)
This creates a live probability forecast that updates as price evolves. The tool also supports range memory, allowing traders to analyze the last completed range after a breakout has occurred. A dynamic strength meter is displayed directly above each consolidation range, providing real-time insight into range compression and breakout potential.
Signals and Breakouts
Advanced Range Analyzer Pro includes a structured set of visual tools to highlight actionable conditions:
Range Zones – Gradient-filled boxes highlight active consolidations.
Strength Meter – A live score displayed in the dashboard quantifies compression.
Breakout Labels – Probability percentages show bias toward bullish or bearish continuation.
Breakout Highlights – When a breakout occurs, the range is marked with directional confirmation.
Dashboard Table – Displays current status, strength, live/last range mode, and probabilities.
These elements update in real time, ensuring that traders always see the current state of consolidation and breakout risk.
Interpretation
Range Strength : High scores (70–100) indicate strong consolidations likely to resolve explosively, while low scores suggest weak or choppy ranges prone to false signals.
Breakout Probability : Directional bias greater than 60% suggests meaningful breakout pressure. Equal probabilities indicate balanced compression, favoring mean-reversion strategies.
Market Context : Ranges aligned with higher timeframe trends often resolve in the dominant direction, while counter-trend ranges may lead to reversals or liquidity sweeps.
Volatility Insight : Tight ranges with low ATR imply imminent expansion; wide ranges signal extended consolidation or distribution phases.
Strategy Integration
Advanced Range Analyzer Pro can be applied across multiple trading styles:
Breakout Trading : Enter on probability shifts above 60% with confirmation of volume or momentum.
Mean Reversion : Trade inside ranges with high strength scores by fading boundaries and targeting equilibrium.
Trend Continuation : Focus on ranges that form mid-trend, anticipating continuation after consolidation.
Liquidity Sweeps : Use failed breakouts at boundaries to capture reversals.
Multi-Timeframe : Apply on higher timeframes to frame market context, then execute on lower timeframes.
Advanced Techniques
Combine with volume profiles to identify areas of institutional positioning within ranges.
Track sequences of strong consolidations for trend development or exhaustion signals.
Use breakout probability shifts in conjunction with order flow or momentum indicators to refine entries.
Monitor expanding/contracting range widths to anticipate volatility cycles.
Custom parameters allow fine-tuning sensitivity for different assets (crypto, forex, equities) and trading styles (scalping, intraday, swing).
Inputs and Customization
Range Detection Sensitivity : Controls how strictly ranges are defined.
Strength Score Settings : Adjust weighting of compression, volume, and breakout memory.
Probability Forecasting : Enable/disable directional bias and thresholds.
Gradient & Fill Options : Customize range visualization colors and opacity.
Dashboard Display : Toggle live vs last range, info table size, and position.
Breakout Highlighting : Choose border/zone emphasis on breakout events.
Why Use Advanced Range Analyzer Pro
This indicator provides a data-driven approach to trading consolidation phases, one of the most common yet underutilized market states. By quantifying range strength, mapping probability forecasts, and visually presenting risk zones, it transforms uncertainty into clarity.
Whether you’re trading breakouts, fading ranges, or mapping higher timeframe context, Advanced Range Analyzer Pro delivers a structured, adaptive framework that integrates seamlessly into multiple strategies.

ATR - Daily vs CurrentThis script provides a comprehensive view of the Average True Range (ATR) for both the current trading day and a multi-day lookback, giving traders real-time insight into volatility and potential daily price movement. Key features include:
ATR Table:
- Average ATR: 14-day ATR, representing typical daily volatility.
- Today’s ATR: Current day ATR, showing how much the price has moved so far.
- % of Avg ATR Used: Calculates the percentage of the average ATR that has been realized today, helping assess if a move is near exhaustion.
Possible Daily ATR Range Lines:
- Horizontal lines drawn from today’s open representing ±50% and ±100% of the 14-day ATR, providing a visual guide for potential price extremes.
- Lines are updated once per day and extend from the right to the left, clearly marking possible intraday range limits.
Color-coded for clarity:
- Green = +50% ATR
- Red = -50% ATR
- Lime = +100% ATR
- Maroon = -100% ATR
Usage:
- Useful for day traders and intraday scalpers to track volatility and potential price targets.
- Helps in risk management, setting stops, and estimating realistic intraday moves.
- Provides visual cues for when price has consumed a significant portion of expected daily range.
Note: ATR is a statistical measure; the lines represent possible ranges, not guaranteed targets. Daily market conditions may prevent price from reaching full ATR.

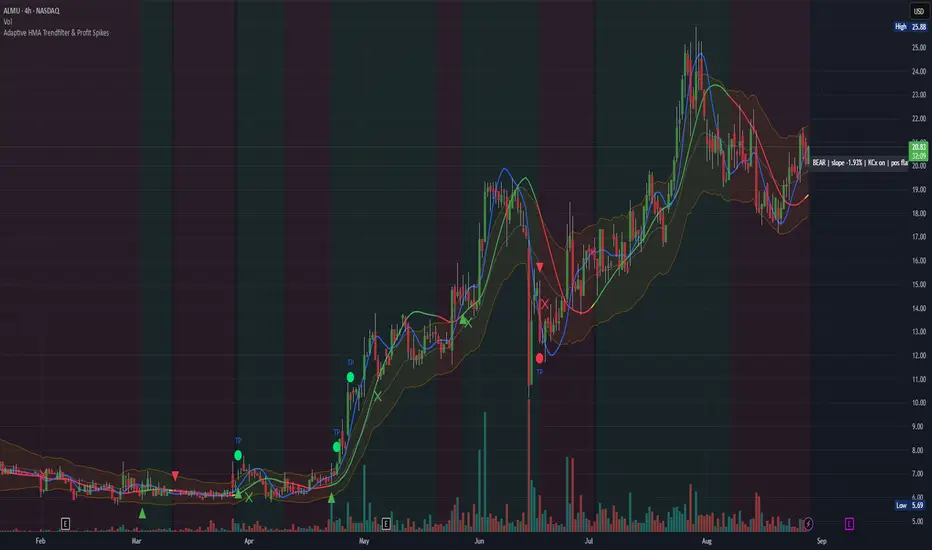
Adaptive HMA Trendfilter & Profit SpikesShort Description
Adaptive trend-following filter using Hull Moving Average (HMA) slope.
Includes optional Keltner Channel entries/exits and dynamic spike-based take-profit markers (ATR/Z-Score).
Optional Fast HMA for early entry visualization (not included in logic).
USER GUIDE:
1) Quick Overview
Trend Filter: Slow HMA defines Bull / Bear / Sideways (via slope & direction).
Entries / Exits:
Entry: Color change of the slow HMA (red→green = Long, green→red = Short), optionally filtered by the Keltner basis.
Exit: Preferably via Keltner Band (Long: Close under Upper Band; Short: Close above Lower Band).
Fallback: exit on opposite HMA color change.
Take-Profit Spikes: Marks abnormal moves (ATR, Z-Score, or both) as discretionary TP signals.
Fast HMA (optional): Purely visual for early entry opportunities; not part of the core trading logic (see §5).
2) Adding & Basic Setup
Add the indicator to your chart.
Open Settings (gear icon) and configure:
HMA: Slow HMA Length = 55, Slope Lookback = 10, Slope Threshold = 0.20%.
Keltner: KC Length = 20, Multiplier = 1.5.
Spike-TP: Mode = ATR+Z, ATR Length = 14, Z Length = 20, Cooldown = 5.
Optionally: enable Fast HMA (e.g., length = 20).
3) Input Parameters – Key Controls
Slow HMA Length: Higher = smoother, fewer but cleaner signals.
Slope Lookback: How far back HMA slope is compared against.
Slope Threshold (%): Minimum slope to avoid “Sideways” regime.
KC Length / Multiplier: Width and reactivity of Keltner Channels.
Exits via KC Bands: Toggle on/off (recommended: on).
Entries only above/below KC Basis: Helps filter out chop.
Spike Mode: Choose ATR, Z, or ATR+Z (stricter, fewer signals).
Spikes only when in position: TP markers show only when you’re in a trade.
4) Entry & Exit Logic
Entries
Long: Slow HMA turns from red → green, and (if filter enabled) Close > KC Basis.
Short: Slow HMA turns from green → red, and (if filter enabled) Close < KC Basis.
Exits
KC Exit (recommended):
Long → crossunder(close, Upper KC) closes trade.
Short → crossover(close, Lower KC).
Fallback Exit: If KC Exits are off → exit on opposite HMA color change.
Spike-TP (Discretionary)
Marks unusually large deviations from HMA.
Use for partial profits or tightening stops.
⚠️ Not auto-traded — only marker/alert.
5) Early Entry Opportunities (Fast HMA Cross – visual only)
The script can optionally display a Fast HMA (e.g., 20) alongside the Slow HMA (e.g., 55).
Bullish early hint: Fast HMA crosses above Slow HMA, or stays above, before the Slow HMA officially turns green.
Bearish early hint: opposite.
⚠️ These signals are not part of the built-in logic — they are purely discretionary:
Advantage: Earlier entries, more profit potential.
Risk: Higher chance of whipsaws.
Practical workflow (early long entry):
Fast HMA crosses above Slow HMA AND Close > KC Basis.
Enter small position with tight stop (under KC Basis or HMA swing).
Once Slow HMA confirms green → add to position or trail stop tighter.
6) Recommended Presets
Crypto (1h/2h):
HMA: 55 / 10 / 0.20–0.30%
KC: 20 / 1.5–1.8
Spikes: ATR+Z, ATR=14, Z=20, Cooldown 5
FX (1h/4h):
HMA: 55 / 8–10 / 0.10–0.25%
KC: 20 / 1.2–1.5
Indices (15m/1h):
HMA: 50–60 / 8–12 / 0.15–0.30%
KC: 20 / 1.3–1.6
Fine-tuning:
Too noisy? → Raise slope threshold or increase HMA length.
Too sluggish? → Lower slope threshold or shorten HMA length.
7) Alerts – Best Practice
Long/Short Entry – get notified when trend color switches & KC filter is valid.
Long/Short Exit – for KC exits or fallback exits.
Long/Short Spike TP – for discretionary profit-taking.
Set via TradingView: Create Alert → Select this indicator → choose condition.
8) Common Pitfalls & Tips
Too many false signals?
Raise slope threshold (more “Sideways” filtering).
Enable KC filter for entries.
Entries too late?
Use Fast HMA cross for early discretionary entries.
Or lower slope threshold slightly.
Spikes too rare/frequent?
More frequent → ATR mode or lower ATR multiplier / Z-threshold.
Rarer but stronger → ATR+Z with higher thresholds.
9) Example Playbook (Long Trade)
Regime: Slow HMA still red, Fast HMA crosses upward (early hint).
Filter: Close > KC Basis.
Early Entry: Small size, stop below KC Basis or recent swing low.
Confirmation: Slow HMA turns green → scale up or trail stop.
Management: Partial profits at Spike-TP marker; full exit at KC upper band break.
ICT AI ATR Signals [TradingFinder]🔵 Introduction
In financial markets, two main factors always have the greatest impact on traders’ decisions: the direction of the trend and the level of price volatility. Although there are various tools to analyze each of these factors, very few indicators can combine them in a coordinated and simultaneous way.
The ICT AI ATR indicator has been designed with this purpose in mind, to provide a unified and comprehensive view of the market instead of relying on multiple scattered indicators.
This indicator is built upon two widely used tools: the Moving Average (MA) and the Average True Range (ATR). The combination of these two indicators allows traders to simultaneously track the trend direction and account for market volatility two elements that always play a decisive role in trading decisions.
In the structure of the indicator, the Moving Average acts as the central line and serves as the backbone of the tool. By calculating the average price over a defined period, the Moving Average filters out excess market noise and provides a clearer picture of the overall price movement.
This helps traders focus on the main trend instead of being distracted by minor and temporary fluctuations. The central line is thus the main reference point for identifying the trend direction.
Alongside this, the ATR is responsible for measuring the real volatility of the market. Unlike many tools that only look at closing price changes, the ATR considers the true range of candlestick movements, giving a more accurate view of market dynamics.
In the ICT AI ATR indicator, this feature is used to draw dynamic bands above and below the Moving Average line. These bands shift with changing market conditions and act like dynamic support and resistance levels, areas where strong price reactions often occur.
This combination allows traders not only to see the dominant market trend through the Moving Average but also to understand volatility and the natural price range via the ATR. For this reason, the ICT AI ATR identifies points that are likely to act as reaction or reversal zones, whether during bounces off the bands or breakouts through them.
With this structure, the trader can at a glance :
Identify the overall market direction using the Moving Average.
Observe volatility and the natural range of price movement through ATR.
Recognize key levels where strong reactions or potential reversals are more likely.
As a result, the ICT AI ATR functions as a combined tool that replaces the need to use several separate indicators, enabling traders to analyze trend, volatility, price bands, and even Fibonacci targets within a single unified framework.
🔵 How to Use
The ICT AI ATR indicator is designed to simplify market analysis through two main components: visual display of bands and signals on the chart itself, and a multi-symbol analytical dashboard capable of monitoring over 20 different assets simultaneously across multiple timeframes.
This dashboard feature allows traders to gain a quick overview of overall market conditions without opening multiple charts or constantly switching timeframes. It updates in real-time, showing active Buy (Long) and Sell signals for each symbol.
As such, the combination of direct chart display and dashboard analytics makes the indicator useful both for detailed analysis of a single symbol and for monitoring multiple markets at once.
🟣 How do ICT AI ATR trading signals work?
Sell Signal (Short) : Triggered when the price pushes below the lower band (Low goes outside the lower band) and then closes back above it. This indicates potential weakness in bullish momentum and suggests possible selling pressure or the start of a downward correction. Traders can use this to spot sell setups or manage long positions.
Buy Signal (Long) : Triggered when the price extends above the upper band (High goes outside the upper band) and then closes back below it. This often signals exhaustion in bearish pressure and the return of buying strength, potentially marking the start of a new upward move.
This signaling logic is based on the actual behavior of price relative to the ATR dynamic bands. Unlike static formulas, signals adapt to changing market conditions, making them more accurate and reliable.
The main advantage of the ICT AI ATR indicator is that traders can benefit from real-time analysis directly on the chart by observing price interactions with the bands and signals while also receiving a multi-market overview through the dashboard. This combination is especially valuable for traders who operate across multiple instruments or markets simultaneously.
🔵 Settings
🟣 Logical settings
Moving Average Type : Select the type of moving average for the central line. Options include EMA, SMA, RMA, WMA, or HMA depending on the trading strategy.
Moving Average Period : Defines the length of the moving average. Shorter periods make the central line more responsive to price changes, while longer periods smooth out the line to show the broader trend.
ATR Period : Determines the number of candles considered for volatility calculation. Shorter periods increase sensitivity, while longer periods provide a more stable view of volatility.
ATR Multiplier : Sets the distance between the upper/lower bands and the central moving average line. Higher values widen the bands, while lower values bring them closer to price.
Smooth Period: Used to smooth data and reduce chart noise. Higher values produce smoother, more consistent indicator lines.
Signal Gap : Defines the minimum number of candles required between two consecutive signals. This prevents back-to-back signals from appearing too frequently and ensures only the more reliable ones are shown.
🟣 Display Settings
Table on Chart : Allows users to choose the position of the signal dashboard either directly on the chart or below it, depending on their layout preference.
Number of Symbols : Enables users to control how many symbols are displayed in the screener table, from 10 to 20, adjustable in increments of 2 symbols for flexible screening depth.
Table Mode : This setting offers two layout styles for the signal table :
Basic : Mode displays symbols in a single column, using more vertical space.
Extended : Mode arranges symbols in pairs side-by-side, optimizing screen space with a more compact view.
Table Size : Lets you adjust the table’s visual size with options such as: auto, tiny, small, normal, large, huge.
Table Position : Sets the screen location of the table. Choose from 9 possible positions, combining vertical (top, middle, bottom) and horizontal (left, center, right) alignments.
🟣 Symbol Settings
Each of the 10 symbol slots comes with a full set of customizable parameters :
Symbol : Define or select the asset (e.g., XAUUSD, BTCUSD, EURUSD, etc.).
Timeframe : Set your desired timeframe for each symbol (e.g., 15, 60, 240, 1D).
🟣 Alert Settings
Alert : Enables alerts for AAS.
Message Frequency : Determines the frequency of alerts. Options include 'All' (every function call), 'Once Per Bar' (first call within the bar), and 'Once Per Bar Close' (final script execution of the real-time bar). Default is 'Once per Bar'.
Show Alert Time by Time Zone : Configures the time zone for alert messages. Default is 'UTC'.
🔵 Conclusion
The ICT AI ATR indicator, by combining three core elements Moving Average for trend detection, ATR for volatility measurement and dynamic bands, and Fibonacci levels for price targets—provides a multi-layered and intelligent tool for market analysis. In addition to showing accurate bands directly on the chart, it also offers a multi-symbol dashboard that allows traders to monitor signals across different assets and timeframes in real time.
The key advantage of this indicator is that it eliminates the need to use several separate tools by integrating trend, volatility, key levels, and trade signals into one unified framework. For this reason, ICT AI ATR is a reliable and effective choice for both short-term traders seeking quick market moves and long-term traders focused on dynamic support and resistance levels.
유료 스크립트


Better Pivot Points [LuminoAlgo]Overview
The Better Pivot Points indicator is an advanced trend analysis tool that combines Supertrend methodology with automated pivot point identification and zigzag visualization. This indicator helps traders identify significant price turning points and visualize market structure through dynamic pivot labeling and connecting lines.
How It Works
This indicator utilizes a Supertrend-based algorithm to detect meaningful pivot points in price action. Unlike traditional pivot point indicators that rely on fixed time periods, this tool dynamically identifies pivots based on trend changes, providing more relevant and timely signals.
The algorithm tracks trend changes using ATR-based Supertrend crossovers to determine when significant highs and lows have formed. When a trend reversal is detected, the indicator marks the pivot point and draws connecting lines to visualize price flow and market structure progression.
Key Features
• Dynamic Pivot Detection: Automatically identifies high and low pivot points using Supertrend crossovers
• Market Structure Labeling: Labels pivots as HH (Higher High), LH (Lower High), HL (Higher Low), or LL (Lower Low)
• Zigzag Visualization: Connects pivot points with customizable lines to clearly show price flow and market structure
• Color-Coded Analysis: Uses distinct colors to indicate bullish trends (green), bearish trends (red), and neutral conditions (yellow)
• Customizable Parameters: Adjustable ATR period, factor, line width, and line style
Input Settings
• ATR Length: Controls the sensitivity of the Supertrend calculation (default: 21)
• Factor: Multiplier for the ATR-based Supertrend bands (default: 2.0)
• Zigzag Line Width: Customize the thickness of connecting lines (1-4)
• Zigzag Line Style: Choose between Solid, Dashed, or Dotted line styles
What Makes This Original
This indicator combines several analytical concepts into a cohesive tool that differentiates it from standard pivot point indicators:
1. Uses Supertrend crossovers as the trigger for pivot detection rather than traditional high/low lookback periods
2. Automatically categorizes market structure using HH/LH/HL/LL labeling system based on pivot relationships
3. Provides real-time zigzag visualization with intelligent color coding that reflects trend direction
4. Integrates trend direction analysis with structural pivot identification in a single comprehensive tool
The underlying calculations use custom logic for tracking trend states, validating pivot points, and determining appropriate color coding based on market structure analysis.
How to Use
1. Trend Identification: Green lines indicate bullish market structure, red lines show bearish structure, yellow indicates transitional periods
2. Support/Resistance: Pivot points often act as future support and resistance levels for price action
3. Market Structure Analysis: HH and HL patterns suggest uptrends, while LH and LL patterns indicate downtrends
4. Entry/Exit Planning: Use pivot points and trend changes to plan potential trade entries and exits
Important Limitations and Warnings
• This indicator is a technical analysis tool and should not be used as the sole basis for trading decisions
• Pivot points are identified after price moves occur, meaning this indicator has inherent lag and cannot predict future pivots
• False signals can occur during ranging or choppy market conditions where trends are unclear
• Past performance of any indicator does not guarantee future results or trading success
• The indicator works best in clearly trending markets and may produce less reliable signals in sideways price action
• This tool requires interpretation and should be combined with other forms of analysis
• Always use proper risk management and position sizing strategies when trading
Why This Script Is Protected
This indicator uses proprietary algorithms for pivot detection timing, trend state management, and market structure analysis that represent original research and development. The specific logic for pivot validation, color-coding methodology, and structural relationship calculations contains unique approaches that differentiate it from standard pivot point indicators available in the public library.
Disclaimer
This indicator is for educational and analysis purposes only and does not constitute investment advice. Trading involves substantial risk and is not suitable for all investors. Past results are not indicative of future performance. The future is fundamentally unknowable and past results in no way guarantee future performance. Always conduct your own research and consider your risk tolerance before making any trading decisions.

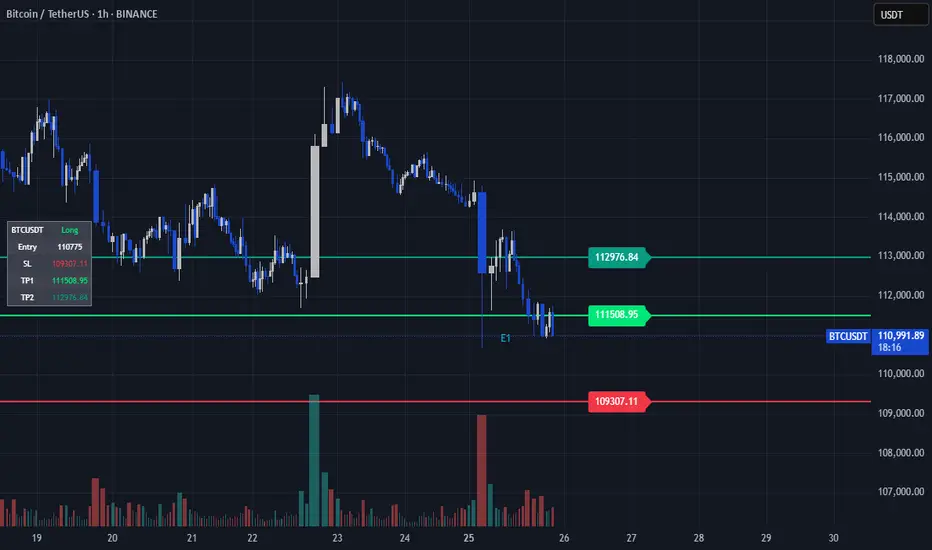
TP/SL Dynamic (FIB,ATR,MULTIPLE,PERCENT)TP/SL Dynamic (FIB, ATR, MULTIPLE, PERCENT)
This indicator provides a flexible framework for managing Take Profit (TP) and Stop Loss (SL) levels using multiple calculation schemes. It is designed for traders who want dynamic or rule-based levels that adapt to volatility, market type, and custom input.
The script supports four TP/SL methodologies:
Pro Standards (Auto-Select): Adapts method based on asset type and volatility.
R Multiples: Risk-based reward multiples from ATR-derived stop distance.
Fibonacci R: Fibonacci extension levels projected from recent pivots.
Percent: Fixed percentage distance from entry, adjusted by volatility.
ATR Multiples: ATR-based calculations with configurable multipliers.
Features:
Up to 3 manual entries, each with configurable time, price, and position size.
Weighted entry price calculation across multiple positions.
Single or multiple TP targets (up to 4) with automatic scaling.
Dynamic ATR option: updates SL/TP levels with live volatility or fixes them at entry.
Pivot-based logic for Fibonacci extensions.
Symbol Locking to prevent mismatches between intended pair and chart symbol.
Table display with optional R-multiples, TP/SL values, and entry details.
Visual chart elements: lines, labels, price-scale markers for SL/TP, and zebra-style info tables.
Entry markers (E1, E2, E3) for clarity.
Alerts for TP and SL triggers (both long and short).
How to Use:
Define entry prices, times, and position sizes (up to 3 entries).
Select a TP method (Pro Standards, R Multiples, Fibonacci R, Percent, or ATR Multiples).
Choose single or multiple TP mode.
Optionally enable Dynamic ATR to update levels in real time.
Check the on-chart table for all calculated levels and alerts.
Author & Credit:
Developed from the ground up by me (no external code used outside The Pine public library).
DEE's Indicator v2 — Daily Range, Averages & Previous High/Low🇺🇸 English
This indicator is designed to help traders analyze market volatility and daily price ranges.
It includes the following features:
• 5-bar analysis: Shows high-low ranges and percentage changes of the last 5 bars.
• Daily Average Range: Calculates daily average ranges based on the last 5 bars.
• Daily AVG Lines: Plots expected top and bottom range levels based on the daily average.
• Previous Day High/Low: Automatically draws lines from the previous day's high and low.
• Timeframe Separators: Adds visual separators between days, months, and years.
• Optional arrows: Displays arrow markers for the last detected bars used in the calculation.
Use cases:
● Intraday traders can quickly measure daily progress compared to the average daily range.
● Swing traders can identify support/resistance levels from previous daily highs and lows.
● Risk managers can monitor when current volatility deviates significantly from the average.
⚠️ Notes:
The script does not generate buy/sell signals; it provides analytical tools only.
All displayed information is for visual/educational purposes and should be combined with your own trading strategy.
👉 Don’t forget to adjust the settings to suit your needs.
If you are using a multi-chart layout with different timeframes and apply this indicator to each chart, the 5-bar data will be calculated separately based on each chart’s TF. However, the “Daily AVG” section will always show the same value for the 1D timeframe.
🇺🇿 O‘zbekcha
Ushbu indikator treyderlarga bozor volatilligi va kundalik narx diapazonlarini tahlil qilishda yordam berish uchun mo‘ljallangan.
Unda quyidagi funksiyalar mavjud:
• 5-bar tahlili: So‘nggi 5 ta bar diapazoni (high–low) va foiz o‘zgarishini ko‘rsatadi.
• Kundalik o‘rtacha diapazon: So‘nggi 5 ta bar asosida o‘rtacha kundalik diapazonni hisoblaydi.
• AVG Lines: Daily AVGning yuqori va pastki diapazon darajalarini chizadi.
• Oldingi kunning High/Low darajalari: Avtomatik ravishda oldingi kunning high va low darajalarini chizadi.
• Vaqt ajratgichlari: Kunlar, oylar va yillar orasiga vizual ajratgich qo‘shadi.
• Ixtiyoriy strelkalar: Hisoblash uchun foydalanilgan so‘nggi barlarda strelka belgilarini ko‘rsatadi.
Qo‘llanilishi:
● Intraday treyderlar kundalik natijani o‘rtacha kundalik diapazon bilan tezda solishtira olishadi.
● Swing treyderlar oldingi kunning high va low darajalaridan qo‘llab-quvvatlash/qarshilik darajalarini aniqlashlari mumkin.
● Risk-menejerlar hozirgi volatillik o‘rtachadan sezilarli darajada og‘ib ketganini kuzatishlari mumkin.
⚠️ Eslatma:
Ushbu indikator sotib olish/sotish signallarini bermaydi; u faqat tahliliy vosita sifatida ishlatiladi.
Ko‘rsatilgan barcha ma’lumotlar vizual/ta’limiy maqsadlarda mo‘ljallangan bo‘lib, o‘z strategiyangiz bilan birgalikda qo‘llanilishi lozim.
👉 Sozlamalarni ehtiyojlaringizga qarab moslashtirishni unutmang.
Agar siz multi-chart rejimida turli timeframelar bilan ishlasangiz va ushbu indikatorni har bir grafikda qo‘llasangiz, 5 ta bar haqidagi ma’lumotlar har bir grafikning o‘z TFiga qarab hisoblanadi. Ammo “Daily AVG” bo‘limida esa faqat 1D timeframe uchun bir xil qiymat ko‘rsatiladi.
🇷🇺 Русский
Этот индикатор предназначен для помощи трейдерам в анализе волатильности рынка и дневных ценовых диапазонов.
Он включает в себя следующие функции:
• Анализ 5 свечей: Показывает диапазон high–low и процентные изменения последних 5 свечей.
• Средний дневной диапазон: Рассчитывает средний дневной диапазон на основе последних 5 свечей.
• Линии среднего диапазона (AVG Lines): Строит ожидаемые верхние и нижние уровни диапазона на основе среднего дневного значения.
• Максимум/минимум предыдущего дня: Автоматически наносит линии с уровнями high и low предыдущего дня.
• Разделители временных интервалов: Добавляет визуальные разделители между днями, месяцами и годами.
• Опциональные стрелки: Показывает стрелки на последних свечах, использованных в расчётах.
Применение:
● Интрадей-трейдеры могут быстро измерять дневное движение по сравнению со средним дневным диапазоном.
● Свинг-трейдеры могут определять уровни поддержки/сопротивления по максимумам и минимумам предыдущего дня.
● Риск-менеджеры могут контролировать ситуации, когда текущая волатильность значительно отклоняется от среднего.
⚠️ Примечания:
Этот индикатор не генерирует сигналы на покупку/продажу; он предоставляет только аналитические инструменты.
Вся отображаемая информация предназначена для визуальных/образовательных целей и должна использоваться совместно с вашей торговой стратегией.
👉 Не забудьте настроить параметры под свои нужды.
Если вы работаете в режиме мульти-графика с разными таймфреймами и применяете этот индикатор на каждом графике, данные по 5 барам будут рассчитываться отдельно для каждого ТФ. Однако в разделе “Daily AVG” всегда отображается одно и то же значение для таймфрейма 1D.
© Dilshod Nurmatov Shuhratovich | deetradesonline | 2025

Custom ATR BandsThis indicator provides a customisable, easy to view band around the price, based on the ATR. The ATR length and multiplier can be adjusted.
Strict VWAP+EMA Trend Aligner with Volume Power - SUBODH BAJPAIAuthor: SUBODH BAJPAI
This indicator combines VWAP, EMA crossover, and Volume Strength filters into a single, easy-to-read system with clear signals and backtest-ready logic.
🔑 Features
• VWAP Tracking → Confirms trend bias (Above = Bullish, Below = Bearish).
• EMA 10/20 Crossovers → Detects momentum shifts (10 > 20 = Long trend).
• Volume Strength Check → Uses both Vol/VolSMA and RVOL thresholds to validate real demand/supply.
• Strict Align Mode → A Long signal triggers only when ALL conditions agree (VWAP, EMA crossover, strong volume).
• ATR-based Stop Loss & Take Profit → Built-in risk management with RR targeting and optional trailing stop.
• Smart Debounce → Prevents noisy/repeated signals by enforcing cooldown bars.
• Backtest Ready → Full strategy version available in Strategy Tester.
🎯 Usage
• Works on any timeframe (intraday → swing).
• Best used on liquid stocks, indices, or futures.
• Look for “LONG” arrows/shapes when all confirmations align.
• Use along with your own support/resistance levels or price action setups.
⚠️ Disclaimer
This script is for educational purposes only.
Not financial advice. Always validate signals with your own strategy and risk management.

Average True Ranges with IBD RSAdvanced ATR Analysis with IBD Relative Strength
This comprehensive indicator combines Average True Range (ATR) analysis with IBD (Investor's Business Daily) Relative Strength calculation, providing both volatility measurement and momentum analysis in one powerful tool.
Key Features:
ATR Analysis:
Standard ATR: Customizable period (default 14) with multiple smoothing options
1.5x ATR: Extended range for wider stop-loss and target calculations
Smoothing Options: Choose between RMA, SMA, EMA, or WMA for ATR calculation
Customizable Colors: Distinct colors for easy visual identification
IBD Relative Strength:
Professional RS Formula: Uses the same calculation method as Investor's Business Daily
Multi-Timeframe Analysis: Compares current price to 3, 6, 9, and 12-month performance
Weighted Calculation: 40% weight on 3-month, 20% each on 6, 9, and 12-month performance
Zero-Based Scale: Values above 0 indicate outperformance, below 0 indicate underperformance
Trading Applications:
Volatility-Based Stops: Use ATR and 1.5x ATR for dynamic stop-loss placement
Position Sizing: ATR helps determine appropriate position size based on volatility
Relative Strength Analysis: IBD RS identifies stocks with superior momentum
Market Timing: High RS values often precede strong price moves
Risk Management: Combine volatility (ATR) with momentum (RS) for comprehensive analysis
Technical Details:
ATR Calculation: True Range smoothed over selected period with chosen method
IBD RS Formula: (40% × 3M) + (20% × 6M) + (20% × 9M) + (20% × 12M) - 100
Display: Separate pane indicator with customizable colors for each component
How to Interpret:
High ATR: Increased volatility, wider stops needed
Low ATR: Reduced volatility, tighter stops possible
Positive IBD RS: Stock outperforming market over measured periods
Negative IBD RS: Stock underperforming market over measured periods
Customizable Parameters:
ATR calculation length
Smoothing method for ATR
Individual colors for ATR, 1.5x ATR, and IBD RS lines
Perfect for swing traders and position traders who want to combine volatility analysis with relative strength momentum in their decision-making process. Particularly useful for stock selection and risk management.

Average True Range %The ATR% oscillator measures market volatility as a percentage of the closing price, smooths it using a chosen method (RMA, SMA, EMA, or WMA), and compares it to the threshold levels of 0.95% and 1.20%.
Relative Volatility Mass [SciQua]The ⚖️ Relative Volatility Mass (RVM) is a volatility-based tool inspired by the Relative Volatility Index (RVI) .
While the RVI measures the ratio of upward to downward volatility over a period, RVM takes a different approach:
It sums the standard deviation of price changes over a rolling window, separating upward volatility from downward volatility .
The result is a measure of the total “volatility mass” over a user-defined period, rather than an average or normalized ratio.
This makes RVM particularly useful for identifying sustained high-volatility conditions without being diluted by averaging.
────────────────────────────────────────────────────────────
╭────────────╮
How It Works
╰────────────╯
1. Standard Deviation Calculation
• Computes the standard deviation of the chosen `Source` over a `Standard Deviation Length` (`stdDevLen`).
2. Directional Separation
• Volatility on up bars (`chg > 0`) is treated as upward volatility .
• Volatility on down bars (`chg < 0`) is treated as downward volatility .
3. Rolling Sum
• Over a `Sum Length` (`sumLen`), the upward and downward volatilities are summed separately using `math.sum()`.
4. Relative Volatility Mass
• The two sums are added together to get the total volatility mass for the rolling window.
Formula:
RVM = Σ(σ up) + Σ(σ down)
where σ is the standard deviation over `stdDevLen`.
╭────────────╮
Key Features
╰────────────╯
Directional Volatility Tracking – Differentiates between volatility during price advances vs. declines.
Rolling Volatility Mass – Shows the total standard deviation accumulation over a given period.
Optional Smoothing – Multiple MA types, including SMA, EMA, SMMA (RMA), WMA, VWMA.
Bollinger Band Overlay – Available when SMA is selected, with adjustable standard deviation multiplier.
Configurable Source – Apply RVM to `close`, `open`, `hl2`, or any custom source.
╭─────╮
Usage
╰─────╯
Trend Confirmation: High RVM values can confirm strong trending conditions.
Breakout Detection: Spikes in RVM often precede or accompany price breakouts.
Volatility Cycle Analysis: Compare periods of contraction and expansion.
RVM is not bounded like the RVI, so absolute values depend on market volatility and chosen parameters.
Consider normalizing or using smoothing for easier visual comparison.
╭────────────────╮
Example Settings
╰────────────────╯
Short-term volatility detection: `stdDevLen = 5`, `sumLen = 10`
Medium-term trend volatility: `stdDevLen = 14`, `sumLen = 20`
Enable `SMA + Bollinger Bands` to visualize when volatility is unusually high or low relative to recent history.
╭───────────────────╮
Notes & Limitations
╰───────────────────╯
Not a directional signal by itself — use alongside price structure, volume, or other indicators.
Higher `sumLen` will smooth short-term fluctuations but reduce responsiveness.
Because it sums, not averages, values will scale with both volatility and chosen window size.
╭───────╮
Credits
╰───────╯
Based on the Relative Volatility Index concept by Donald Dorsey (1993).
TradingView
SciQua - Joshua Danford
