DWP_VWAP Rolling Average
Hello,
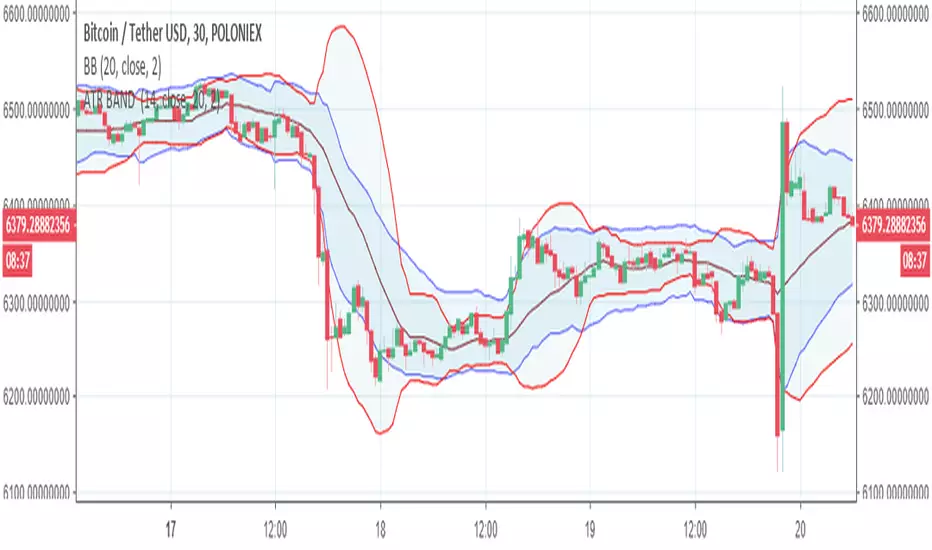
This indicator is a Rolling VAWP . Unlike the regular VWAP that will restart the volume calculation at a certain time interval. This one recalculates the VWAP looking backward at a set length of time. This creates a more even indicator. I have added Average True Range Bands to show the strength of the move. Set the Lookback bar length to your liking and compare the strength of the move to the prior moves strength and determine market direction.
Hope this helps you to see the market.
MoveTrap
ATR

ADR - Average Daily Range [@treypeng] [v2]
This is an intraday indicator.
Average Daily Range provides an upper and lower level around the daily open. It is calculated by taking an EMA/SMA average of a given number of previous days' True Range.
It can be useful for helping guide support and resistance, for taking profits and for placing stops.
It's a similar idea to the ATR indicator, but calculated on a daily timeframe only.
Settings:
Length: number of days to take an average from
Offset: Set this to 0 to include today's range. Set to 1 to exclude today. Set to 2 to exclude today and yesterday.....and so on.
The other settings should be self explanatory :)

ATR Trend by Atilla YurtsevenATR Trend
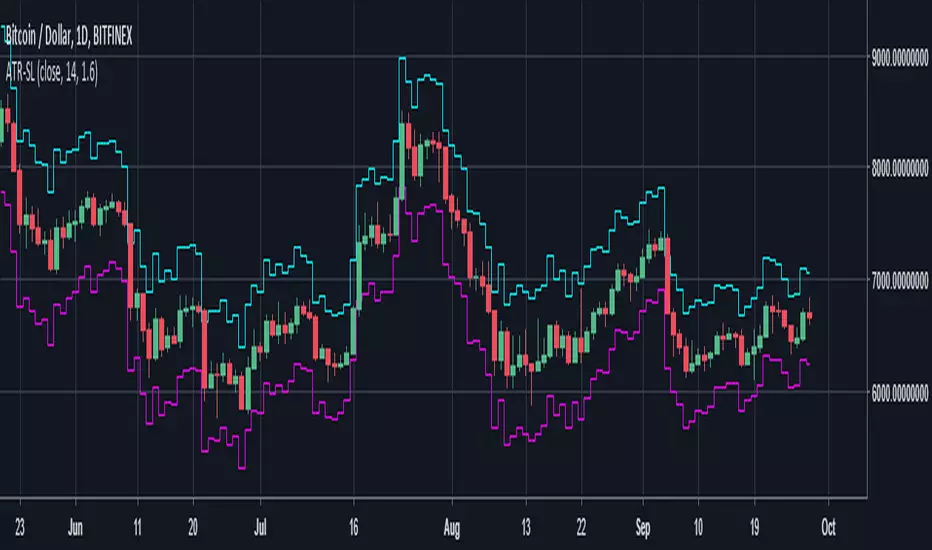
I see that lots of traders use ATR as their stop-loss and take-profit levels. I decided to write this script to help traders to easily calculate their ATR levels. ATR also works as support and resistance. That's why i have decided to call this indicator as "ATR Trend".
I hope you enjoy it!
Disclaimer: Past performance is not an indication of future performance. All the information in this article, including the algorithm & indicator, was provided and published for informational purposes only and should not be considered legal or financial advice. Use at your own risk!
Happy trading
Atilla Yurtseven

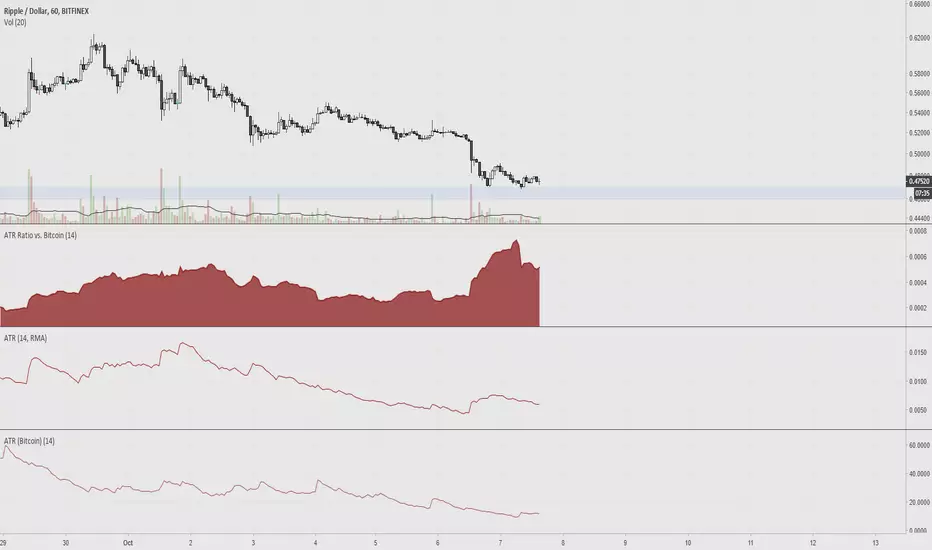
ATR Ratio vs. BitcoinAverage True Range is used to determine if a ticker's trading range is widening or narrowing, which is helpful for finding the trend or to use as a stop loss. The idea of this indicator is to compare the ATR of altcoins versus bitcoin, since volatility is low.
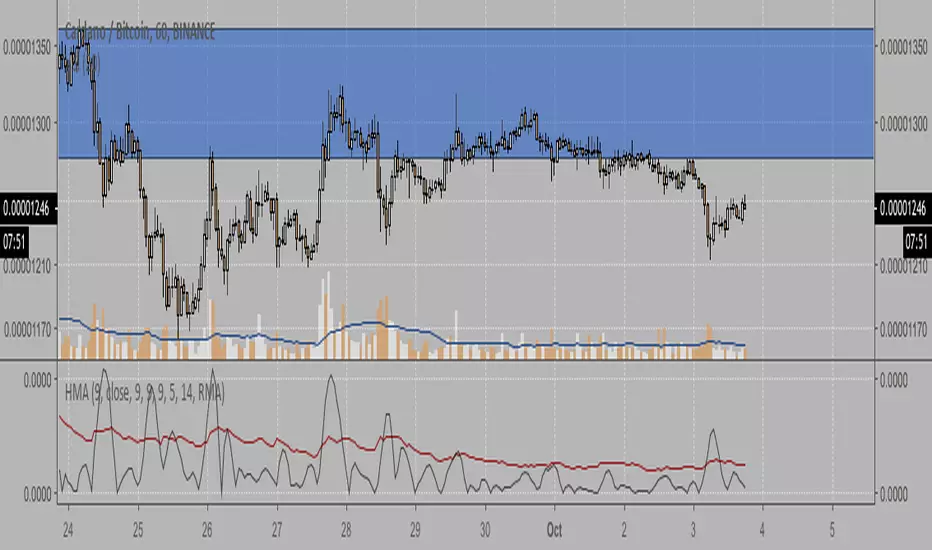
Hull MAxMABlack line - abs(hma-ma)
Red line - ATR
When Black line is above red – short time reversal
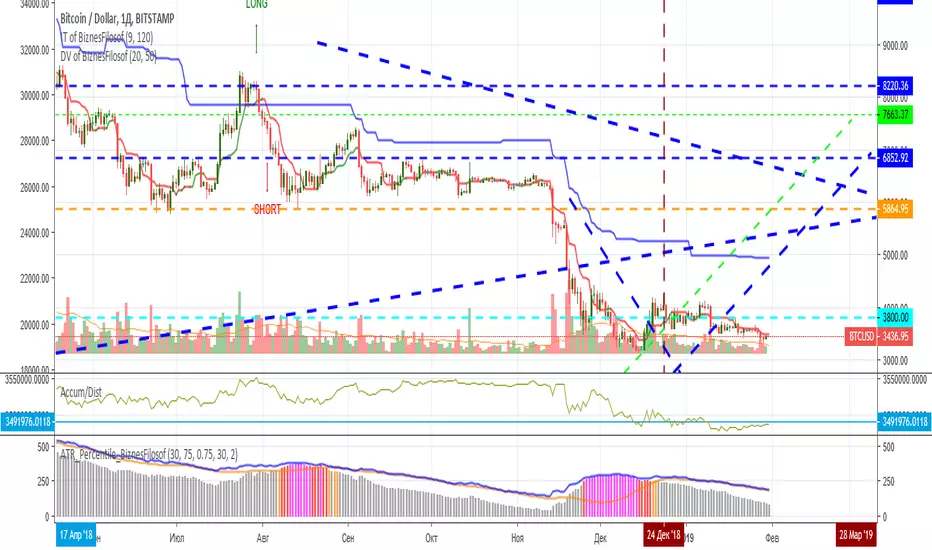
ATR Percentile BiznesFilosofThis script was created based on statistics and market research. Here you can see the increase in the activity of large players. Those. when they begin to take out "extra passengers", gaining a position for a strong trend movement in the aftermath. Also they can be found with stops and takeprofit (their value for the most likely operation).
By default, the red line stands at around 190. But then you can edit it for the current situation. Ideally, it should be at the lowest level of volatility (ATR).
The gray zone is favorable for setting stops and calculating the take-profit.
If you reduce the scale of the chart, you can see the red zone of market activity. This helps to understand when there is a lull in the big players (whales) and when they are again activated for the new pampas.
In more detail, I'm talking about this indicator on my channel in Youtube.
===
Этот скрипт создан, исходя из статистики и исследований рынка. Здесь можно увидеть повышение активности крупных игроков. Т.е. когда начинают выносить "лишних пассажиров", набирают позицию для сильного трендового движения в последствии. Также на основании данного индикатора можно определиться со стопами и тейкпрофитом (их величиной для наиболее вероятного срабатывания).
По умолчанию красная линия стоит на отметке 190. Но потом её можно отредактировать под текущую ситуацию. В идеале она должна быть на самом нижнем уровне волатильности (ATR).
Серая зона благоприятная для установки стопов и расчета тейкпрофита.
Если уменьшить масштаб графика, то можно увидеть красные зоны активности рынка. Это помогает понять, когда происходит затишье крупных игроков (китов) и когда опять они активируются для нового пампа.
Более подробно я рассказываю про этот индикатор на своём канале в Ютуб.
VWAP ATRATR Trailing stoploss with VWAP for confirmation and entry/exit points
VWAP resets on ATR cross


Gunbot Deluxe Tuners BE [Alerts]Revision 18
Gunbot Deluxe Tuners BE Alerts is part of the official Gunthy version of Gunbot Deluxe Tuners.
It is the companion Alerts script for the Gunbot Deluxe Tuners BE (Black Edition) backtesting and optimizing script.
This Alerts script allows user to automatically send alerts directly to Gunbot through the Gunbot TradingView addon.
Available only to verified Gunbot owners. No exceptions. Anyone interested in obtaining this script must contact either their official Gunbot reseller or me privately.
No public requests or donations for access to this script will be granted. No exceptions.
NOTICE: By requesting access to this script you acknowledge that you have read and understood that this is for research purposes only and neither I or Gunthy are responsible for any financial losses you may incur by using this script!

MTFATRTSMulti-timeframe Average True Range Trailing Stops. Only overlay *HIGHER* timeframe only. Higher timeframe ATR lines are displayed as thicker lines.


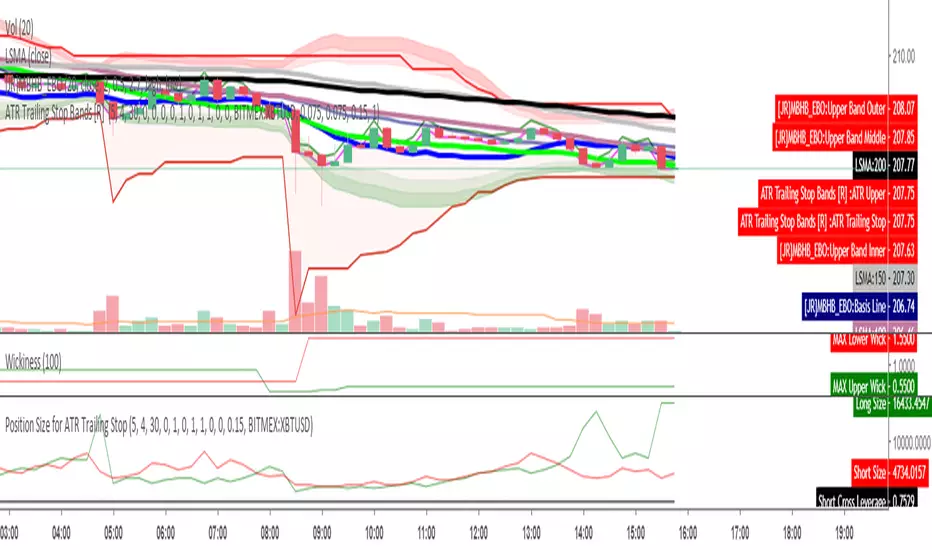
Position Size for ATR Trailing StopThis indicator will calculate your position size, short or long, based on the ATR Trailing Stop indicator of mine, and are needed to be used together. General risk management suggests risking just 1 percent of your equity and using low leverage.
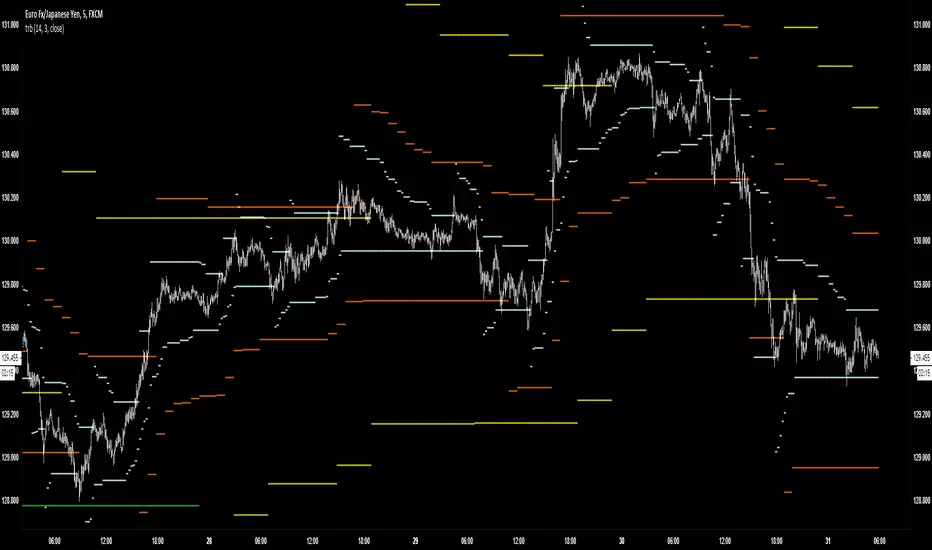
TRBTrue Range Bands; the 'Supertrend', also known as a volatility stop, using a 14 period length and 3x multiplier.
Rojbin_Strategy_1D_[babelii]Rojbin Oscillator for cryptocurrency
Used :
1- ADX
2- CCI
3-MACDI
4-ATR
5-MA


ATR Bands [NeoButane]ATR bands, smoothed with exponential moving averages.
The difference between this and other ATR bands is that high and low are used as the source for top and bottom band, resulting in more accurate ATRs. It is also calculated in log-space to aid in making the bands more "springy" when it comes to extremely volatile assets or very low timeframes.
See here for an upgraded version:

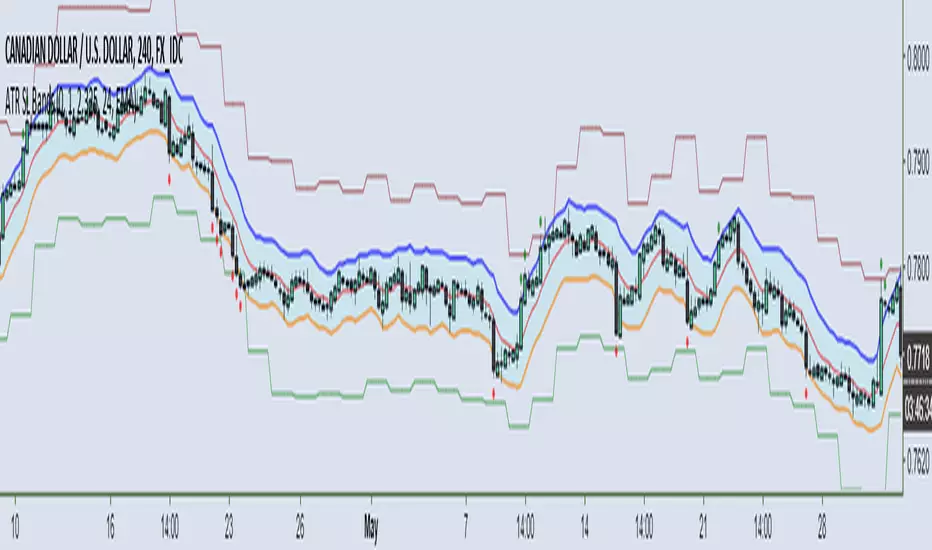
ATR Trailing Stop Bands [NeoButane]These ATR bands and trailing stops can be used as a way to manage risk, enter breakout trades, or as support/resistance.
Please see here for information about payment and access: medium.com
ATR Bands Features:
Shape plotted for closes out of bands
Custom resolution
Bands multiplier: useful for reducing size to increase signal
Band smoothing type: EMA, Hull MA, or no moving average smoothing
Calculated in geometric mean (log scaling) to resolve issues with flash dumps or pumps
Alerts for closing outside of bands
ATR Trailing Stop Features:
Based on daily resolution timeframe
Trailing stop multiplier: useful for curve-fitting to your instrument's normal trading range. Recommended multiplier between 1.5-3
Can be used as trading range (>3) or for breakout trading (<1.5)
Alerts for price touching stops
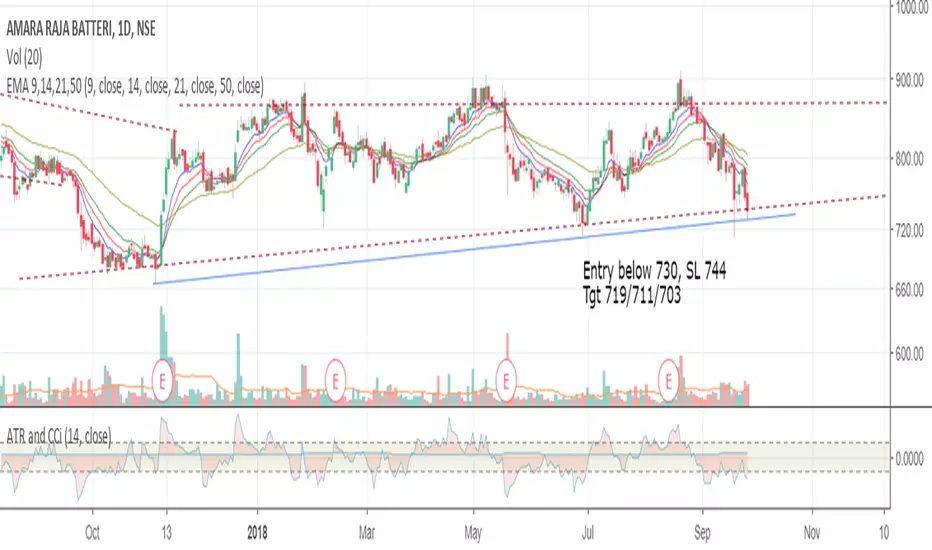
Hull MA +- ATR by shoxi Added HMA-ATR and HMA+ATR to make easier taking profits and placing stop losses in intraday trading.

RSI Swing Signal - ChartThis indicator is the chart version intended to accompany my custom RSI oscillator:
CLICK HERE TO SEE BASE INDICATOR
CLICK HERE TO SEE BASE INDICATOR
