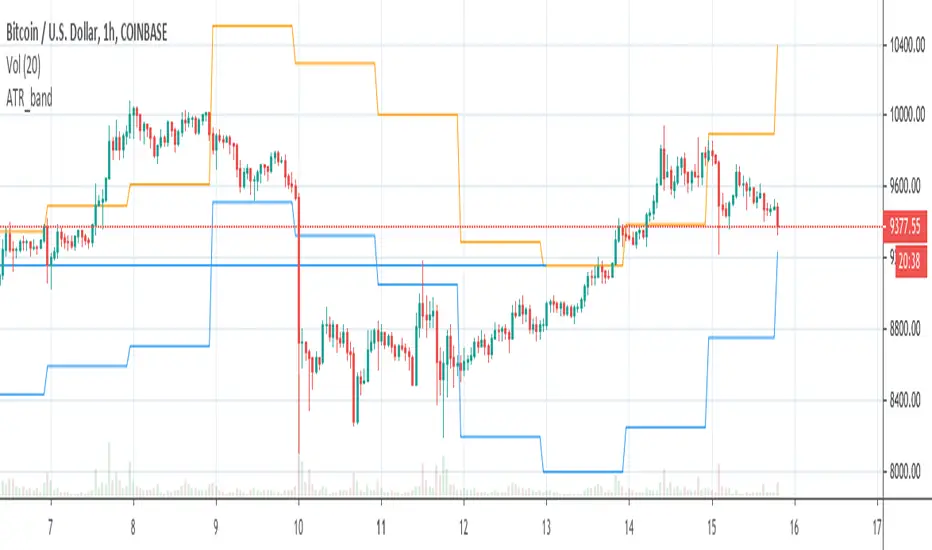
ATR_bandCreates lower and upper band on BTCUSD chart based on ATR value of the previous day and daily open of the current day
ATR
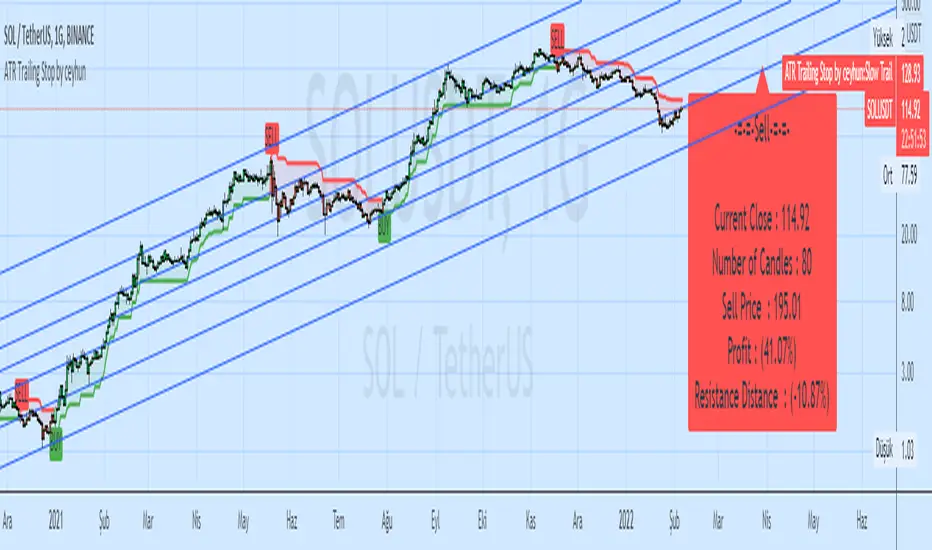
ATR Trailing Stop by ceyhunSame coding only coloring and information panel was added.
CDC ATR Trailing Stop V2.1 (2013)
//Barcolor
Green = Trail1 > Trail2 and close > Trail2 and low > Trail2
Blue = Trail1 > Trail2 and close > Trail2 and low < Trail2
Red = Trail2 > Trail1 and close < Trail2 and high < Trail2
Yellow = Trail2 > Trail1 and close < Trail2 and high > Trail2
//It gives White color where there is deterioration.
//InfoPanel
Buy Price = Blue draws the circles at the purchase price.
Profit Long>20 = Risk level taken as a percentage, I got the highest 20%, you can determine as you wish.
Sell Price = Red draws the circles at the purchase price.
Profit Short>20 = Risk level taken as a percentage, I got the highest 20%, you can determine as you wish.
ATR _NormalizedThis script is good to use with Williams %R indicator, to find out when price has bottomed out.
ATR has to be over 90 and Williams %R ( lenght 52 ) has to be over 95 to find out level around which one is good to buy.
You can check back, to see that this worked very well over history. Best way to use this 2 indicators is with DCA ( dollar cost average ), as area where to buy can go a little bit down and up for as long as few months. So dont just jump in, use DCA .


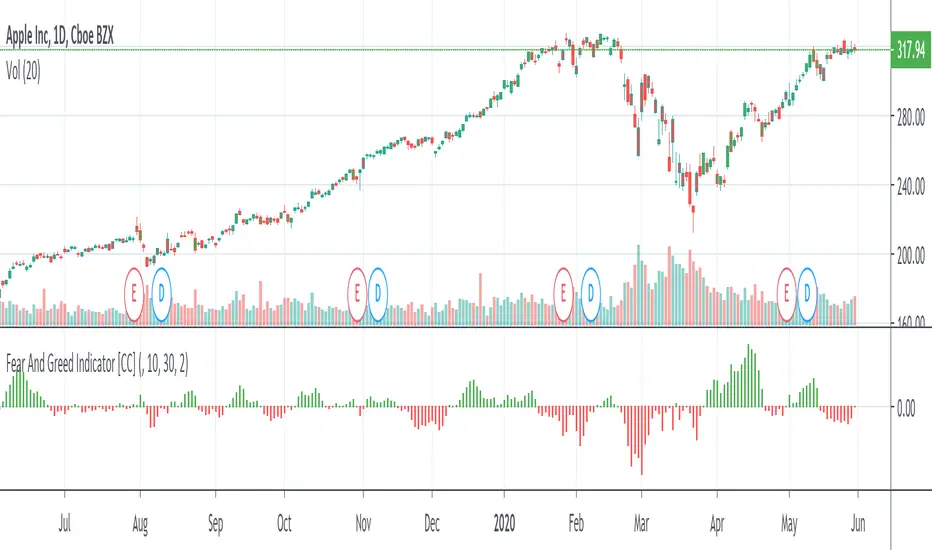
Fear And Greed IndicatorThe Fear And Greed Indicator is a very popular indicator on the Bloomberg platform and since I didn't have actual source code to work with, this is a very close approximation of that indicator. Let me know if you spot any discrepancies with the original and I will do my best to fix them.
For buy and sell signals it is pretty straightforward. Just buy when the green (greed) is in control and sell when the fear (red) is in control
This was a special request so let me know if you want to see more scripts from me or if you want something custom!
Volume_ATR_HistricalVolatilityCompare Volume, ATR, Historical Volatility in same axis. (percentage last 1000)

Show ATR and 1st hour high+low1. Shows TR at daily bars
2. Shows ATR lines intraday: 100% and 75% (customizable)
3. Shows hint with ATR for current day and percent passed
4. Show high and low of the 1st hour

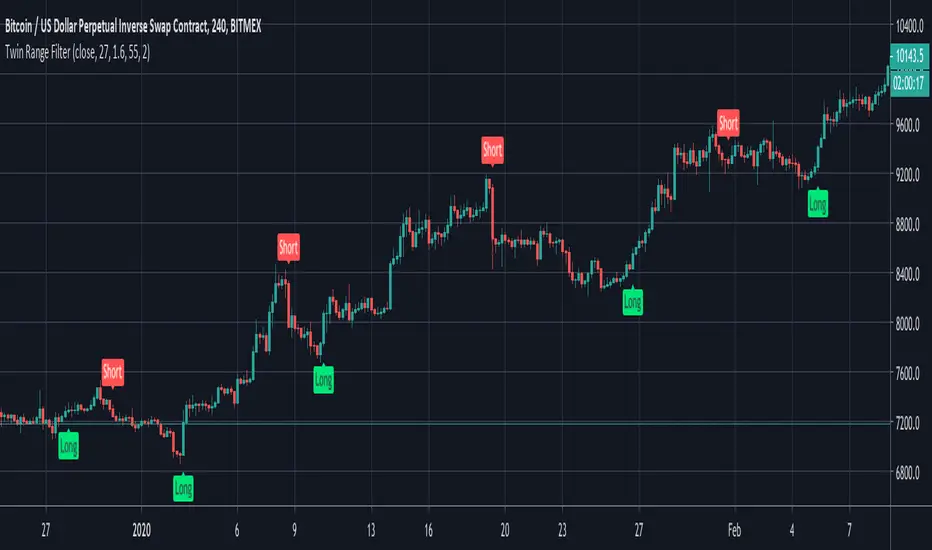
Twin Range FilterAn experiment to combine two range filters and plot the average of both to smooth out the signals.
This works significantly better than the typical ATR set-up, but there's still too much noise here to set and forget with bots. Use it as the basis of your own system with additional filtering on top.
ATR %Displays ATR percentage with 2SD. When value is greater than 12% I consider the stock as highly volatile
Long Wick TrialI've created this as a confirmation indicator to help know when market conditions are favorable to enter a trade. It measures volume, volatility, and ATR. It is not intended to tell you when to enter/exit the market, but use it with another indicator such as the mirror macd to filter out many losses and avoid entering the market during low volume or excessive volatility that may trip your stop loss.
Green = Favorable Market conditions
Yellow = Enter with caution, the market is moving sideways but is slightly trending
Orange = Enter with caution, the market is trending but extremely volatile and may trip stop loss early
Black = Shouldn't enter market here, market is moving sideways and volume is also low.
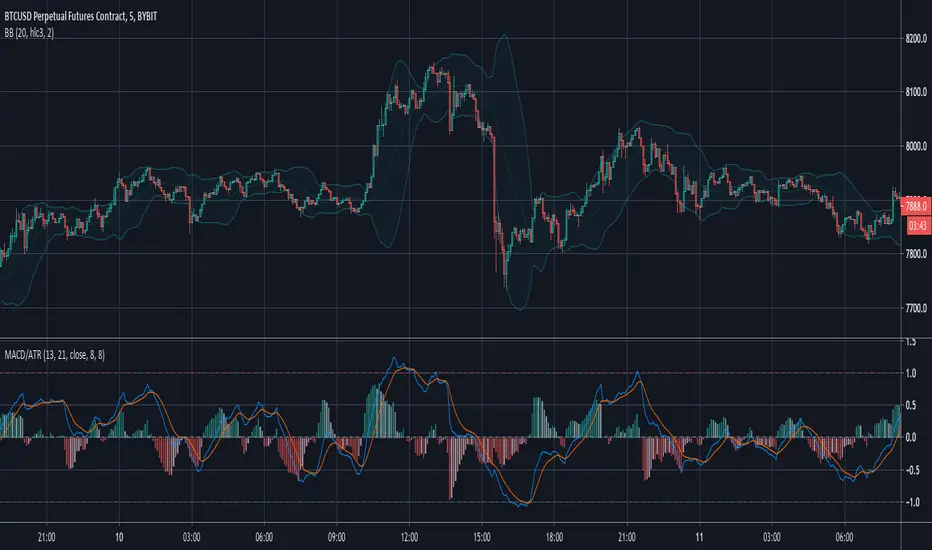
MACD/ATRThis indicator is a restricted MACD .
I reached this with a little trick: I devided it by ATR . This way it is most of the time inside the -1..1 range. It depends on the length of the ATR's period. If it is greater, the probability of outliers is greater.
With this indicator you can use cerain levels of MACD and its histogram as a trigger.
Share with me if you found it useful.
[mya] ATR FilteredATR Filtered for NNFX trading.
A classic Average True Range (ATR) indicator with a simple feature to filter out the spikes.
The ATR value is the tool to determine your TP and SL on daily time-frame, specifically in the NNFX way of trading.
VP mentions in his podcast that when the ATR spikes up you have 2 options: 1. wait 14 candles for the ATR to normalize, 2. use the ATR value prior to the spike.
ATR spikes are easy to spot (thus easy to exclude) for an itraday flash crash.
On the other hand when volatility increases over several candles (as in the Covid-19 shock) it can be difficult to determine which ATR value to base your TP/SL on.
In definition of standard deviation, 95.4% of the value will fall within the 2 sigma bands. Therefore the rest 4.6% can be filtered out as an extreme value (a spike).
The ATR in this indicator will plot the standard ATR value in normal condition, then when the ATR spike happens it will stay at the highest value at the point, when the ATR exceeded its 2 sigma band.
The filtering will reset when the ATR comes back down below the extended highest value.
*Disclaimer: Use at your own risk. I am not a programmer, just another guy trying to beat this game. Let's go get it.

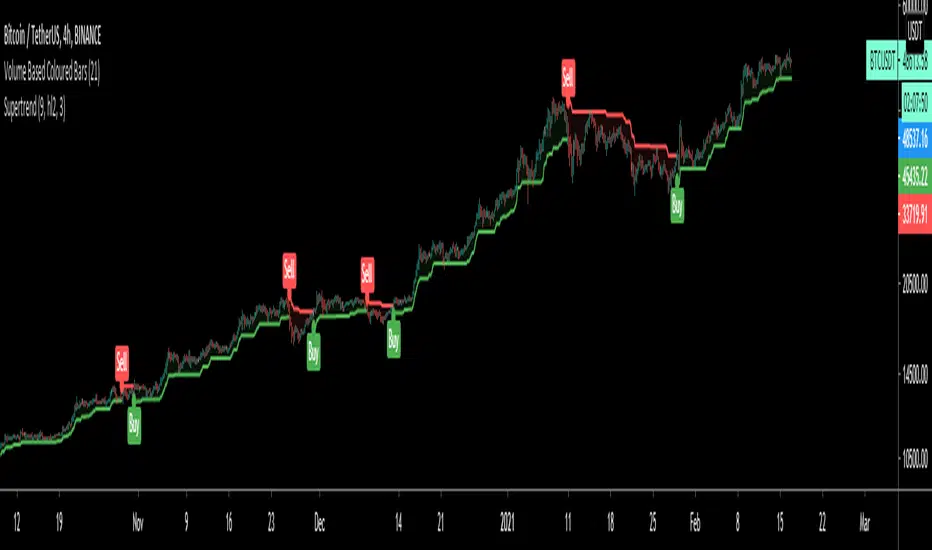
SuperTrendSuperTrend is one of the most common ATR based trailing stop indicators.
In this version you can change the ATR calculation method from the settings. Default method is RMA, when the alternative method is SMA.
The indicator is easy to use and gives an accurate reading about an ongoing trend. It is constructed with two parameters, namely period and multiplier. The default values used while constructing a superindicator are 10 for average true range or trading period and three for its multiplier.
The average true range (ATR) plays an important role in 'Supertrend' as the indicator uses ATR to calculate its value. The ATR indicator signals the degree of price volatility.
The buy and sell signals are generated when the indicator starts plotting either on top of the closing price or below the closing price. A buy signal is generated when the ‘Supertrend’ closes above the price and a sell signal is generated when it closes below the closing price.
It also suggests that the trend is shifting from descending mode to ascending mode. Contrary to this, when a ‘Supertrend’ closes above the price, it generates a sell signal as the colour of the indicator changes into red.
A ‘Supertrend’ indicator can be used on equities, futures or forex, or even crypto markets and also on daily, weekly and hourly charts as well, but generally, it fails in a sideways-moving market.
I had converted Supertrend indicator code for various platforms like Metastock in 2017, but in this TradingView version special credit goes to everget - Alex Orekhov which gave a great inspiration to look my indicators better with highlights, signals and alarms. Thank you Alex.
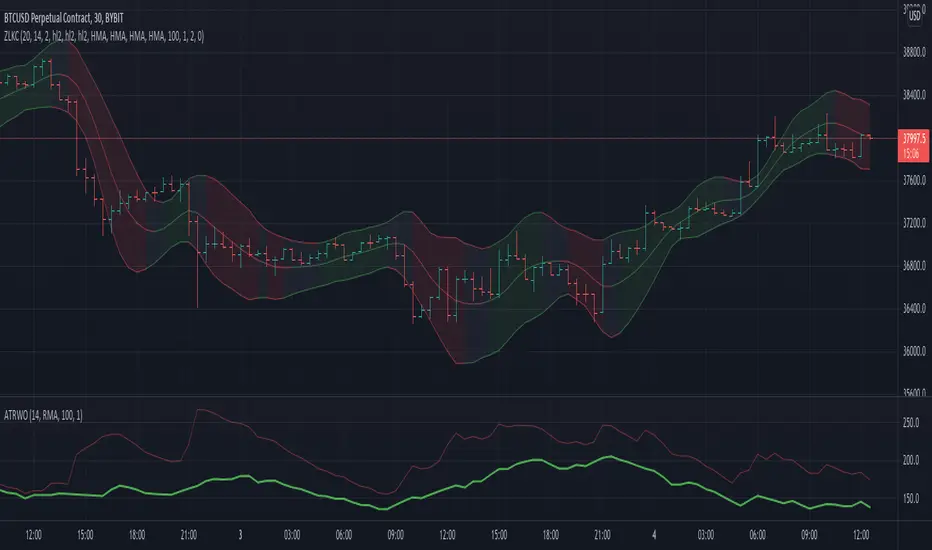
Zero Lag Keltner ChannelsThis is Keltner Channelz (KC) with Zero Lag Moving Average (ZLMA as base). It is smoother and has less lag than the original (EMA/SMA) variant.
It also can be used as a trend indicator and trend confirmation indicator. The upper and lower bands are green if it is an up trend, and red if a down trend. If both have the same color it is a stronger trend.
ATR based Stop and Take-Profit levels in realtime Little tool to quickly identify stops and take-profit levels based on Average True Range. User can change ATR multipiers, as well as the ATR length used. Green and red lines show these levels; plot is visible over last 8 bars only to reduce clutter. Label showing the current ATR, up above the last bar

UT Bot AlertsUT Bot indicator was initially developer by @Yo_adriiiiaan
The idea of original code belongs @HPotter
These are v4 alerts for my previously published strategy:
Original script:

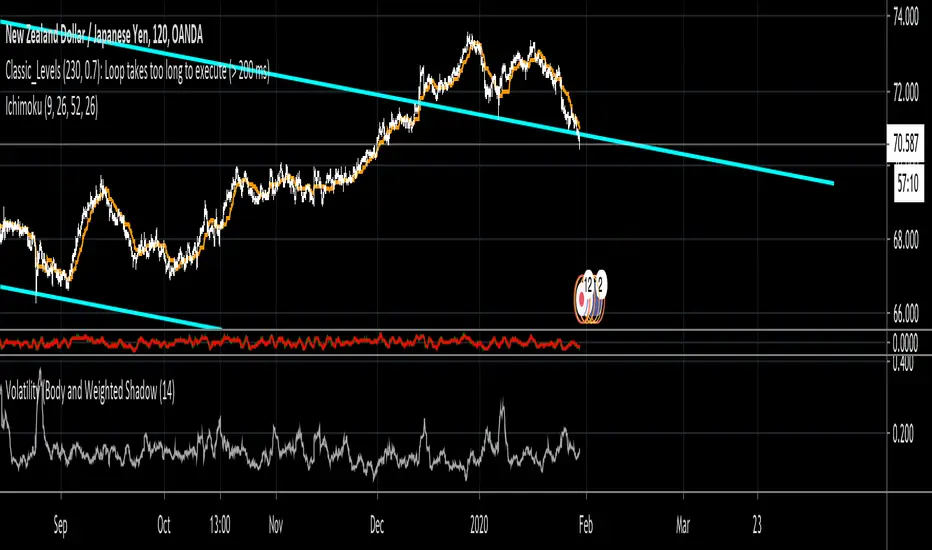
Volatility (Body and Weighted Shadow)- Volatility Indicator
- Replacement for ATR
- As each pair holds a different level of volatility, a stop loss can be set using this indicator rather than via a ratio 2:1, etc. e.g. 2 X Volatility Value = S/L...
- This indicator averages the bodies of candlesticks over a default length of 14 periods. It also considers the length of shadows via a weighted average. This is done as it is assumed that financial institutions tend to move price to levels that do not hold (shadows). Therefore, wick lengths are less significant than the candlestick bodies, so they are weighted to hold less value.
Simple Moving Average - ATR Trailing StopThe old adage goes "Cut losers fast and let the winners run"
With this in mind, this will plot a dynamic trailing stop by subtracting any multiplier of the Average True Range (ATR) from the SMA of your choice.

ATR [Gu5]ATR (Average True Range) by Sylvain Vervoort
In contrast to other ATR indicators, the line changes color when profits start
A diferencia de otros indicadores ATR, la linea cambia de color cunado empezamos a tomas ganancias

BEST Supertrend MAHello traders,
That one is an experiment
I was curious to see what a supertrend based on moving average cross could give
How does it work?
Bull event: fast moving average crossing over the slow moving average
Bear event: fast moving average crossing under the slow moving average
When the event is triggered, the script will plot the Supertrend as follow
UP Trend = ohlc4+ ATR * Factor
DOWN Trend = ohlc4- ATR * Factor
Interesting to see the results given by ohlc4 vs hl2 and hl3
Documentation: www.tradingview.com
This is an alternative of the classical Supertrend based on candle close being above/beyond the previous Supertrend level.
Hope you'll enjoy it and it will improve your trading making you a better trader
Dave

BEST Supertrend CCIHello traders
Today I present you a Supertrend not based on candle close but based on a CCI (Commodity Channel Index)
How does it work?
Bull event: CCI crossing over the 0 line
Bear event: CCI crossing below the 0 line
When the event is triggered, the script will plot the Supertrend as follow
UP Trend = High + ATR * Factor
DOWN Trend = Low - ATR * Factor
This is an alternative of the classical Supertrend based on candle close being above/beyond the previous Supertrend level.
Hope you'll enjoy it and it will improve your trading making you a better trader
Dave

Average True Range Percentage (ATRP)ATR measures volatility, but you can't compare one instrument vs. another with it because the ATR value will be different depending on the price of the instrument. I went searching for something like ATR but with percentages, so you could compare one stock vs. another to find who is more volatile and found this .
It was exactly what I was looking for, so decided to re-create it in TradingView. Enjoy!
Description
Average True Range Percent (ATRP) expresses the Average True Range (ATR) indicator as a percentage of a bar’s closing price.
How this indicator works
ATRP is used to measure volatility just as the Average True Range (ATR) indicator is. ATRP allows securities to be compared, where ATR does not.
ATR measures volatility at an absolute level, meaning lower priced stock will have lower ATR values than higher price stocks. ATRP displays the indicator as a percentage, to allow for securities trading at different prices per share to be compared.
Calculation
ATRP = (Average True Range / Close) * 100

Maximum True RamgePlots the the highest true range for the entire dataset.
Beneficial for determine an emergency stopp loss.
