Shadow Range IndexShadow Range Index (SRI) introduces a new concept to calculate momentum, shadow range.
What is range?
Traditionally, True Range (TR) is the current high minus the current low of each bar in the timeframe. This is often used successfully on its own in indicators, or as a moving average in ATR (Average True Range).
To calculate range, SRI uses an innovative calculation of current bar range that also considers the previous bar. It calculates the difference between its maximum upward and maximum downward values over the number of bars the user chooses (by adjusting ‘Range lookback’).
What is shadow range?
True Range (TR) uses elements in its calculation (the highs and lows of the bar) that are also visible on the chart bars. Shadow range does not, though.
SRI calculates shadow range in a similar formula to range, except that this time it works out the difference between the minimum upward and minimum downward movement. This movement is by its nature less than the maximums, hence a shadow of it. Although more subtle, shadow range is significant, because it is quantifiable, and goes in one direction or another.
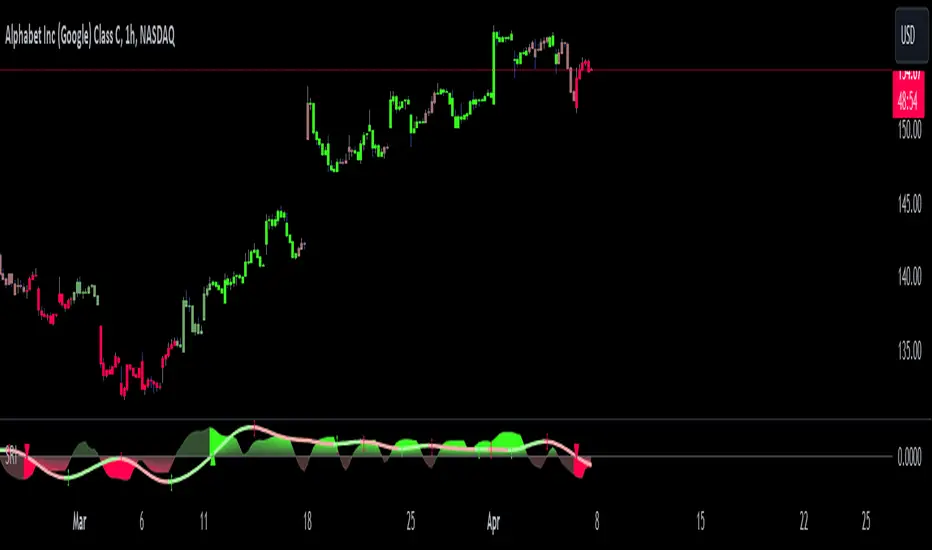
Finally, SRI smoothes shadow range and plots it as a histogram, and also smoothes and plots range as a signal line. Useful up and down triangles show trend changes, which optionally colour the chart bars.
Here’s an example of a long trade setup:
In summary, Shadow Range Index identifies and traces maximum and minimum bar range movement both up and down, and plots them as centred oscillators. The dynamics between the two can provide insights into the chart's performance and future direction.
Credit to these authors, whose MA or filters form part of this script:
@balipour - Super Smoother MA
@cheatcountry - Hann window smoothing
@AlgoAlpha - Gaussian filter
Arnaudlegouxmovingaverage
Trade Pro - Rejection Zone IndicatorThe Rejection Zone Indicator can be used to help trend following traders know when to buy dips in up trends, and when to sell pull backs in down trends.
The Rejection Zone Indicator is made up of the 20 and 50 period Exponential Moving Averages. This indicator has colored shading in between these two EMAs, which acts as a nice visual. When the 20 period Exponential Moving Average is below the 50 period Exponential Moving Average, the shaded cloud will be red, and when the 20 EMA is over the 50 EMA the cloud will be green. It is called the Rejection Zone indicator, because often in trends when price pulls back to the colored cloud, it will act as an area of support or resistance.
The suggested use of the Rejection Zone Indicator is to look for long trades when the cloud is green, and once price has pulled back into the green cloud. If the cloud is red one can look for short trading opportunity when price pulls back into the red cloud.
Moving Average PanelThis indicator calculates many different moving averages and displays whether they are increasing or decreasing as a panel/table instead of a plot. Rows/columns can be removed from the table as needed in the options menu, there is also a mobile friendly/compact option as well as a location option.
Note: This script is large and may take a few moments to load.
Note: If there is not enough data, will default to bearish/decreasing.
Value Added
This is the most complete and transparent moving average panel/table indicator. Unlike things such as the Technical Ratings, you can see what components are increasing or decreasing.
There may be some advantage in judging if a trend is likely to reverse or not based on the MA's with less lag.
Good for quick screening of charts.
Double CCIThe Commodity Channel Index (CCI) is a momentum oscillator used in technical analysis primarily to identify overbought and oversold levels by measuring an instrument's variations away from its statistical mean. Besides overbought/oversold levels, CCI is often used to find reversals as well as divergences. Originally, the indicator was designed to be used for identifying trends in commodities, however it is now used in a wide range of financial instruments.
There are several steps involved in calculating the CCI. The following example is for a typical 14 Period CCI:
CCI = (Typical Price - 14 Period SMA of TP) / (.015 x Mean Deviation)
Typical Price (TP) = (High + Low + Close)/3
Constant = .015
The Constant is set at .015 for scaling purposes. By including the constant, the majority of CCI values will fall within the 100 to -100 range.
Mean Deviation:
1) Subtract the most recent 14 Period Simple Moving from each typical price (TP) for the Period.
2) Sum these numbers strictly using absolute values.
3) Divide the value generated in step 2 by the total number of Periods (14 in this case).
Overbought and Oversold conditions can be used in their more traditional sense to identify future reversals . Remember true overbought/oversold thresholds values can and often do vary between instruments.
During a Bullish Trend , price crossing above the overbought threshold may indicate strong confidence in the move and price will continue to rise.
During a Bearish Trend , price crossing below the oversold threshold may indicate strong confidence in the move and price will continue to fall.
The first option is a modified CCI indicator that uses the "Arnaud Legoux Moving Average" instead of the SMA, and the source uses the VWAP instead of the HLC3. Added to this version an option to calculate CCI with different types of moving averages:
Green dots mean they are overbought
Orange dots mean they are oversold
Added a "SuperTrend Background" based on the modified CCI indicator:
Bull event = CCI crossing over the 0 line
Bear event = CCI crossing below the 0 line
Added a signal as EMA (modified CCI, signal length)
The second option is a standard CCI indicator that shows a coloured histogram of important levels, giving a good visual of the CCI levels. Added to this version is an extra coloured level +/-200 and an option to use Traditional CCI calculations according to user @JustUncleL
LEVELS:
Aqua: Greater than 200.
Lavender: Greater than 100 and less than 200.
Dark Lavender: Greater than 0 and less than 100.
Dark Coral: Less than 0 and greater than -100.
Coral: Less than -100 and greater than -200.
Light Red: Less than -200.