FxAST Trend Force [ALLDYN]Attribution
This indicator is based on the original Trend Speed Analyzer created by Zeiierman .
FxAST Trend Force is a modified and simplified derivative that preserves the core methodology while focusing on clarity, usability, and practical trend interpretation .
This indicator is intended for educational and analytical use. Derivative works must retain attribution and license terms.
__________________________________________________________________________________
FxAST Trend Force
Overview
FxAST Trend Force is a directional pressure indicator designed to show who is in control of the market and how strong that control is, in real time.
Instead of measuring raw price speed or traditional momentum, this tool focuses on trend force — the sustained push of price relative to a dynamic trend baseline. The result is a clean, intuitive view of trend direction, strength, and condition without complex math or hard-to-interpret ratios.
This indicator is best used as a trend confirmation and trade management tool , not a standalone signal generator.
_________________________________________________________________________________
How It Works
FxAST Trend Force uses a Dynamic Moving Average (DMA) that adapts to changing market conditions. Price behavior relative to this adaptive trend line determines the current trend regime.
While price remains on one side of the trend:
Directional pressure accumulates
Strength builds or weakens
The regime resets only when price decisively crosses the trend
This creates a clear visual representation of trend persistence vs exhaustion , rather than short-term noise.
__________________________________________________________________________________
Core Concepts (Plain English)
Trend
Shows the current directional bias:
Bull → price above the dynamic trend
Bear → price below the dynamic trend
This answers: “Which side is currently in control?”
__________________________________________________________________________________
Strength
Displays how strong the current trend pressure is on a 0–100 scale , normalized to recent market conditions.
Strength is shown both as:
A simple label: Weak / Normal / Strong
A visual meter for quick interpretation
This answers: “Is this move weak, average, or meaningful?”
__________________________________________________________________________________
State
Indicates whether trend force is:
Building → pressure increasing
Fading → pressure weakening
This answers: “Is the trend gaining energy or losing it?”
__________________________________________________________________________________
Visual Meter
A compact bar at the bottom of the table represents trend force intensity at a glance.
Longer bar → stronger sustained pressure
Shorter bar → weaker or stalling trend
No ratios. No multipliers. Just visual clarity.
__________________________________________________________________________________
How to Use
Trend Confirmation
Favor longs when Trend = Bull and Strength = Normal/Strong
Favor shorts when Trend = Bear and Strength = Normal/Strong
__________________________________________________________________________________
Trade Management
Building state supports continuation
Fading state warns of exhaustion, consolidation, or potential reversal
__________________________________________________________________________________
Filtering Noise
Weak strength often signals chop or low-quality conditions
Strong force helps filter false breakouts
__________________________________________________________________________________
Settings (Simplified)
Maximum Length
Controls how smooth or responsive the dynamic trend is.
Accelerator Multiplier
Adjusts how quickly the trend adapts to price changes.
Lookback Period
Defines the window used to normalize trend force.
Enable Candles
Colors price candles by trend force for visual clarity.
Show Simple Table
Toggles the Trend / Strength / State display.
__________________________________________________________________________________
Philosophy
FxAST Trend Force is intentionally not a signal-spamming indicator.
It is designed to reduce cognitive load , not increase it.
If you need:
exact entries → use price action
exact exits → use structure
context and confirmation → use Trend Force
__________________________________________________________________________________
Disclaimer
This indicator is provided for educational purposes only and does not constitute financial advice. Trading involves risk, and users are responsible for their own decisions.
Alldynpipking

FxAST Ichi ProSeries Enhanced Full Market Regime EngineFxAST Ichi ProSeries v1.x is a modernized Ichimoku engine that keeps the classic logic but adds a full market regime engine for any market and instrument.”
Multi-timeframe cloud overlay
Oracle long-term baseline
Trend regime classifier (Bull / Bear / Transition / Range)
Chikou & Cloud breakout signals
HTF + Oracle + Trend dashboard
Alert-ready structure for automation
No repainting: all HTF calls use lookahead_off.
1. Core Ichimoku Engine
Code sections:
Input group: Core Ichimoku
Function: ichiCalc()
Variables: tenkan, kijun, spanA, spanB, chikou
What it does
Calculates the classic Ichimoku components:
Tenkan (Conversion Line) – fast Donchian average (convLen)
Kijun (Base Line) – slower Donchian average (baseLen)
Senkou Span A (Span A / Lead1) – (Tenkan + Kijun)/2
Senkou Span B (Span B / Lead2) – Donchian over spanBLen
Chikou – current close shifted back in time (displace)
Everything else in the indicator builds on this engine.
How to use it (trading)
Tenkan vs Kijun = short-term vs medium-term balance.
Tenkan above Kijun = short-term bullish control; below = bearish control.
Span A / B defines the cloud, which represents equilibrium and support/resistance.
Price above cloud = bullish bias; price below cloud = bearish bias.
Graphic
2. Display & Cloud Styling
Code sections:
Input groups: Display Options, Cloud Styling, Lagging Span & Signals
Variables: showTenkan, showKijun, showChikou, showCloud, bullCloudColor, bearCloudColor, cloudLineWidth, laggingColor
Plots: plot(tenkan), plot(kijun), plot(chikou), p1, p2, fill(p1, p2, ...)
What it does
Lets you toggle individual components:
Show/hide Tenkan, Kijun, Chikou, and the cloud.
Customize cloud colors & opacity:
bullCloudColor when Span A > Span B
bearCloudColor when Span A < Span B
Adjust cloud line width for clarity.
How to use it
Turn off components you don’t use (e.g., hide Chikou if you only want cloud + Tenkan/Kijun).
For higher-timeframe or noisy charts, use thicker Kijun & cloud so structure is easier to see.
Graphic
Before
After
3. HTF Cloud Overlay (Multi-Timeframe)
Code sections:
Input group: HTF Cloud Overlay
Vars: showHTFCloud, htfTf, htfAlpha
Logic: request.security(..., ichiCalc(...)) → htfSpanA, htfSpanB
Plots: pHTF1, pHTF2, fill(pHTF1, pHTF2, ...)
What it does
Pulls higher-timeframe Ichimoku cloud (e.g., 1H, 4H, Daily) onto your current chart.
Uses the same Ichimoku settings but aggregates on htfTf.
Plots an extra, semi-transparent cloud ahead of price:
Greenish when HTF Span A > Span B
Reddish when HTF Span B > Span A
How to use it
Trade LTF (e.g., 5m/15m) only in alignment with HTF trend:
HTF cloud bullish + LTF Ichi bullish → look for longs
HTF cloud bearish + LTF Ichi bearish → look for shorts
Treat HTF cloud boundaries as major S/R zones.
Graphic
4. Oracle Module
Code sections:
Input group: Oracle Module
Vars: useOracle, oracleLen, oracleColor, oracleWidth, oracleSlopeLen
Logic: oracleLine = donchian(oracleLen); slope check vs oracleLine
Plot: plot(useOracle ? oracleLine : na, "Oracle", ...)
What it does
Creates a long-term Donchian baseline (default 208 bars).
Uses a simple slope check:
Current Oracle > Oracle oracleSlopeLen bars ago → Oracle Bull
Current Oracle < Oracle oracleSlopeLen bars ago → Oracle Bear
Slope state is also shown in the dashboard (“Bull / Bear / Flat”).
How to use it
Think of Oracle as your macro anchor :
Only take longs when Oracle is sloping up or flat.
Only take shorts when Oracle is sloping down or flat.
Works well combined with HTF cloud:
HTF cloud bullish + Oracle Bull = higher conviction long bias.
Ideal for Gold / Indices swing trades as a trend filter.
Graphic idea
5. Trend Regime Classifier
Code sections:
Input group: Trend Regime Logic
Vars: useTrendRegime, bgTrendOpacity, minTrendScore
Logic:
priceAboveCloud, priceBelowCloud, priceInsideCloud
Tenkan vs Kijun alignment
Cloud bullish/bearish
bullScore / bearScore (0–3)
regime + regimeLabel + regimeColor
Visuals: bgcolor(regimeColor) and optional barcolor() in priceColoring mode.
What it does
Scores the market in three dimensions :
Price vs Cloud
Tenkan vs Kijun
Cloud Direction (Span A vs Span B)
Each condition contributes +1 to either bullScore or bearScore .
Then:
Bull regime when:
bullScore >= minTrendScore and bullScore > bearScore
Price in cloud → “Range”
Everything else → “Transition”
These regimes are shown as:
Background colors:
Teal = Bull
Maroon = Bear
Orange = Range
Silver = Transition
Optional candle recoloring when priceColoring = true.
How to use it
Filters:
Only buy when regime = Bull or Transition and Oracle/HTF agree.
Only sell when regime = Bear or Transition and Oracle/HTF agree.
No trade zone:
When regime = Range (price inside cloud), avoid new entries; wait for break.
Aggressiveness:
Adjust minTrendScore to be stricter (3) or looser (1).
Graphic
6. Signals: Chikou & Cloud Breakout
Code sections :
Logic:
chikouBuySignal = ta.crossover(chikou, close)
chikouSellSignal = ta.crossunder(chikou, close)
cloudBreakUp = priceInsideCloud and priceAboveCloud
cloudBreakDown = priceInsideCloud and priceBelowCloud
What it does
1. Two key signal groups:
Chikou Cross Signals
Buy when Chikou crosses up through price.
Sell when Chikou crosses down through price.
Classic Ichi confirmation idea: Chikou breaking free of price cluster.
2. Cloud Breakout Signals
Long trigger: yesterday inside cloud → today price breaks above cloud.
Short trigger: yesterday inside cloud → today price breaks below cloud.
Captures “equilibrium → expansion” moves.
These are conditions only in this version (no chart shapes yet) but are fully wired for alerts. (Future Updates)
How to use it
Use Chikou signals as confirmation, not standalone entries:
Eg., Bull regime + Oracle Bull + cloud breakout + Chikou Buy.
Use Cloud Breakouts to catch the first impulsive leg after consolidation.
Graphic
7. Alerts (Automation Ready)
[
b]Code sections:
Input group: Alerts
Vars: useAlertTrend, useAlertChikou, useAlertCloudBO
Alert lines like: "FxAST Ichi Bull Trend", "FxAST Ichi Bull Trend", "FxAST Ichi Cloud Break Up"
What it does
Provides ready-made alert hooks for:
Trend regime (Bull / Bear)
Chikou cross buy/sell
Cloud breakout up/down
Each type can be globally toggled on/off via the inputs (helpful if a user only wants one kind).
How to use it
In TradingView: set alerts using “Any alert() function call” on this indicator.
Then filter which ones fire by:
Turning specific alert toggles on/off in input panel, or
Filtering text in your external bot / webhook side.
Example simple workflow ---> Indicator ---> TV Alert ---> Webhook ---> Bot/Broker
8. FxAST Dashboard
Code sections:
Input group: Dashboard
Vars: showDashboard, dashPos, dash, dashInit
Helper: getDashPos() → position.*
Table cells (updated on barstate.islast):
Row 0: Regime + label
Row 1: Oracle status (Bull / Bear / Flat / Off)
Row 2: HTF Cloud (On + TF / Off)
Row 3: Scores (BullScore / BearScore)
What it does
Displays a compact panel with the state of the whole system :
Current Trend Regime (Bull / Bear / Transition / Range)
Oracle slope state
Whether HTF Cloud is active + which timeframe
Raw Bull / Bear scores (0–3 each)
Position can be set: Top Right, Top Left, Bottom Right, Bottom Left.
How to use it
Treat it like a pilot instrument cluster :
Quick glance: “Are my trend, oracle and HTF all aligned?”
Great for streaming / screenshots: everything important is visible in one place without reading the code.
Graphic (lower right of chart )

Liquidity_Detection_Fx_Shepherd [ALLDYN]### Breakdown of the Basic "Fx_Shepherd_Liquidity" Script
#### 1. **Purpose of the Script:**
This basic version of the "Fx_Shepherd_Liquidity" script is designed to help traders detect potential liquidity grabs by analyzing price movements and candle patterns in the market. It works by identifying large price deviations and compares multiple candles to detect liquidity sweeps either to the upside or downside.
#### 2. **How it Works:**
- **User Inputs:**
- `Maru_rate`: This is a user-defined percentage that helps determine how much the price movement of a candle needs to deviate from the candle's range (high - low) to be considered a liquidity grab.
- `Compare`: Another percentage input used to compare the relative size of three candles versus one candle.
- `MA`: This represents the "Big candle period," or the moving average period for big candles.
- `urgent_rate`: This is used to determine urgency by comparing the current candle's range to an SMA of previous candles.
- **Key Calculation Steps:**
- **Candle Deviation (Up and Down):**
- `Up` measures how much the current candle closes above its open (bullish deviation).
- `Down` measures how much the current candle closes below its open (bearish deviation).
- **Average Deviations:**
- `UP_Sum` and `Do_Sum` calculate the SMA of Up and Down deviations, respectively, over the defined period (MA). These averages help detect when a candle deviates significantly from the norm.
- **Urgency Detection:**
- `Check_Up_Urgent` and `Check_Dow_Urgent` are conditions that check if the current candle’s high-low range exceeds the defined urgent rate. This signals whether the price movement is "urgent" or significant.
- **Liquidity Detection:**
- **For Upward Liquidity:**
- The script checks if the candle is bullish (`close > open`) and whether the price deviation (`close - open`) meets or exceeds the user-defined `Maru_rate`.
- The script then compares the size of the previous three candles (`high - low`) with a single candle (`Compare`) to confirm a liquidity grab.
- Finally, it looks for continuous upward candle patterns to confirm the strength of the move.
- **For Downward Liquidity:**
- Similar logic applies, but for bearish candles. It checks whether the candle is bearish (`close < open`) and applies the same size comparisons to detect downward liquidity grabs.
- **Candle Highlighting:**
- If the conditions for a liquidity grab are met (both urgency and size), the script changes the bar color to green for upward liquidity and yellow for downward liquidity. These colored bars visually highlight the candles that meet the liquidity grab conditions.
- The script also colors up to three consecutive candles if they meet the liquidity grab conditions (offset = -1, -2).
#### 3. **Benefits of Using This Script:**
- **Liquidity Grab Detection:**
This script helps detect potential liquidity grabs, which occur when large players in the market push the price in a direction to trigger stop-losses or lure retail traders into a position before reversing the price direction. By detecting these movements, traders can avoid being trapped and potentially take advantage of the upcoming reversal.
- **Simple & Lightweight:**
The script uses basic inputs and calculations to detect liquidity grabs, making it easy to use and understand. It's less complex than the advanced version, which makes it suitable for traders who prefer simplicity or are new to liquidity grab detection.
- **Visual Clarity:**
The script uses color changes (green for upward grabs and yellow for downward grabs) to help traders easily spot potential liquidity grab areas on the chart. These visual cues make it more straightforward to interpret.
#### 4. **When to Use This Basic Version:**
- **Quick Liquidity Detection:** This script is ideal for traders who need a quick way to detect potential liquidity grabs without the complexity of managing dynamic parameters or volume confirmation.
- **Simplified Trading Strategies:** If your trading strategy doesn’t rely heavily on volume or multi-timeframe liquidity grab adjustments, this script can work well for basic setups where price action is the primary indicator.
- **Faster Execution:** Since this version doesn’t require dynamic adjustments or volume confirmation, it executes faster, making it suitable for traders who need lightweight tools to stay on top of fast-moving markets.
### Conclusion:
The basic version of the **Fx_Shepherd_Liquidity** script offers a simplified tool for detecting potential liquidity grabs. Its straightforward design, adjustable Maru rate, and visual bar color changes make it easy to integrate into any trading strategy focused on price action. While it lacks the advanced features of the premium version, it serves as a solid, lightweight solution for traders who prefer simplicity over complexity.

FxASTLite [ALLDYN]This script, titled "FxASTLite " or "FxAST LX," is a Pine Script indicator designed for trading systems that use multiple technical analysis tools such as EMAs (Exponential Moving Averages) and PSAR (Parabolic Stop and Reverse). The script is overlaid on the price chart, providing insights into market trends and potential buy or sell signals.
### Key Features:
1. **EMA (Exponential Moving Averages)**
- The script plots several EMAs (5, 8, 13, 21, 50, and 200) based on the Heiken Ashi close price. EMAs are helpful in identifying trends, momentum, and potential entry/exit points.
- The script highlights key relationships between the EMAs, such as the crossover or crossunder of faster EMAs (like the 8 EMA) with slower ones (like the 21 EMA). These events often signal potential trend reversals or continuation.
2. **PSAR (Parabolic Stop and Reverse)**
- The script uses the PSAR indicator, which is a trend-following indicator that highlights potential points where the market might reverse direction.
- The script identifies bullish PSAR flips (when the PSAR value moves below the price, signaling a potential upward trend) and bearish PSAR flips (when the PSAR value moves above the price, signaling a downward trend).
- The PSAR flips are used to generate buy or sell signals.
3. **Heiken Ashi Candles**
- It uses Heiken Ashi candles to smooth out price action and better identify trends. Heiken Ashi candles help filter out market noise and make trends clearer compared to regular candlestick charts.
4. **Session Times**
- The script allows traders to track different market sessions (e.g., London, New York, Asia). It identifies and allows users to analyze price action during specific trading hours.
5. **Buy and Sell Signals**
- The script defines multiple conditions for buy and sell signals:
- **Buy Signals**: Generated when certain conditions are met, such as the price moving above key EMAs, bullish PSAR flips, and bullish Heiken Ashi candles.
- **Sell Signals**: Generated when conditions like bearish PSAR flips, bearish candles, and price moving below EMAs are met.
- These signals are designed to guide traders on when to enter or exit trades.
6. **Alerts**
- The script comes with alert conditions, which can be used to set automated alerts for when buy or sell signals occur. This allows the trader to stay informed without constantly monitoring the chart.
### How It Works:
1. **EMA-Based Trend Identification:**
- EMAs help identify the overall market trend. For example, if the 8-period EMA crosses above the 21-period EMA, it signals a potential bullish trend. Conversely, if the 8 EMA crosses below the 21 EMA, it may signal a bearish trend.
2. **PSAR for Trend Reversals:**
- PSAR values provide insight into potential trend reversals. When the PSAR flips (moving from above to below the price or vice versa), the script highlights these flips as potential buy/sell signals.
3. **Combining Signals:**
- The script combines multiple indicators (EMAs, PSAR, and Heiken Ashi candles) to provide stronger confirmations of potential entry and exit points. By using multiple indicators, the script reduces the likelihood of false signals.
4. **Visual Overlay:**
- The script overlays key information on the price chart, such as EMAs and PSAR dots, which makes it easy for traders to visualize market conditions in real-time.
### Benefits of Using This Script:
1. **Trend Identification:**
- The combination of EMAs and PSAR helps traders identify trends early. The visual display of these indicators directly on the chart makes it easier to detect shifts in market sentiment.
2. **Smoothed Candlesticks:**
- By using Heiken Ashi candles, the script smooths out noisy price action, making it easier to spot trends and reduce the likelihood of making impulsive decisions based on short-term volatility.
3. **Buy and Sell Signals:**
- The script generates clear buy and sell signals based on a combination of multiple technical factors (EMAs, PSAR, and Heiken Ashi). This can help traders time their entries and exits more effectively.
4. **Multi-Timeframe Alerts:**
- With the built-in alert functionality, traders can set up alerts for specific signals (like a PSAR flip or EMA crossover) across different timeframes. This helps traders stay informed without having to watch the chart constantly.
5. **Session Management:**
- The ability to track different market sessions allows traders to focus on times of high liquidity and volatility, which are often the best times to trade.
6. **Customizability:**
- The script allows traders to customize the settings for each indicator (e.g., EMA lengths, PSAR settings, session times) according to their trading preferences.
### Use Cases:
- **Trend Trading:**
- Traders who follow market trends can benefit from this script as it uses EMAs and PSAR to identify trending conditions and potential trend reversals.
- **Swing Trading:**
- Swing traders looking to capitalize on medium-term market moves can use the script to identify optimal entry and exit points based on momentum shifts.
- **Intraday Trading:**
- The inclusion of market sessions and real-time alerts makes the script useful for intraday traders who want to focus on specific trading hours, such as the opening of the London or New York sessions.
Overall, this script is designed for traders who rely on technical indicators to guide their trading decisions. The combination of EMAs, PSAR, and Heiken Ashi candles provides a well-rounded view of market trends and potential entry/exit points, making it a powerful tool for traders looking to improve their strategy.

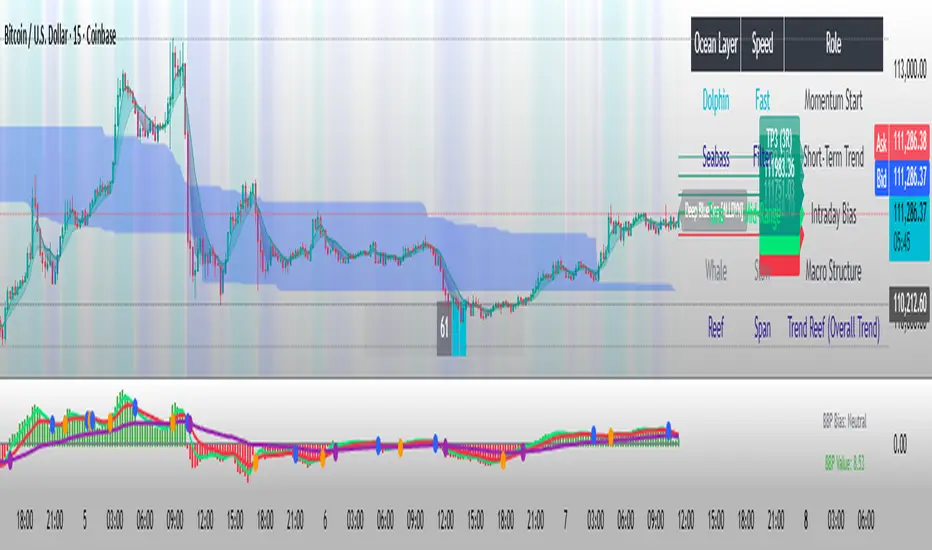
FxAST Bull Bear Power 62 [ALLDYN]I thought I would create something based on what I use in my trading style around Volume Price Analysis and Fibonacci trading.
This tool combines the work of Dr. Alexander Elder (The Elder Ray Index) and the original work done by Rob Booker (The Power of 62).
Basics of the Elder Ray Index: The Elder Ray Index uses indicators to measure buying and selling pressure within a given instrument. The default is what Dr. Alexander used in his trading the 26-period EMA. Technical traders use this information to help determine the direction of a trend. If there is strong bullish pressure, then traders would consider long positions. If there is strong bearish pressure, then traders would consider short positions.
This Tool: My tool gives the bullish and bearish volume as a histogram. The stronger the movement, the longer the histogram bars will be and vice versa as volume pressure weakens. This information allows us to spot divergence with what is happening between the tool and the price action chart. Spotting divergence allows us to wait until we see convergence (things matching the tool and the price action chart) and give us the added confluence we need to consider entering a trade.
Basics of Power Of 62: This system uses 3 Fibonacci EMAs (5-13-62). The 5 is the closest to price action, the 13 is based on the work that Dr. Alexander did measuring bull and bear pressure, and the 62 is based on the .618 or phi of the Fibonacci sequence. Technical traders can use these to gauge trend strength and momentum. For example, 5-13 trending towards the 62 indicates that the market is bullish with a strong bullish confirmation of the 13 crossing above the 62. Conversely, the opposite is valid for a bearish movement and strong confirmation.
This Tool: My tool shows when the 5 crosses the 13 by a visual blue dot. All this indicates is that associated price action is above/below the 13 EMA which if you remember the basics of the Elder Ray index if associated price action is above the 13 indicates the Bulls are in control and if associated price action is below the 13 indicates the Bears are in control. Where these are in relationship to the 62 (above/below) is a strong confirmation of the trend itself. Consider the slope of the lines and the clock analogy. If the lines are between the 1-2 then this is a strong bullish trend. If the lines are between the 4-5 then this is a strong bearish trend. If the lines are flat/horizontal, this indicates price equilibrium and indecision in the market.
Putting it All Together: Combining these concepts allows technical traders to trade with the trend, allowing both systems to give symbiotic confirmations for buying and selling ideas, for example. If we see that the histogram bars are sloping in one direction (above/below 0 line) and we get a cross of the 5-13 trending towards the 62, we can then wait until both cross above/below the 62 AND the histogram is showing bullish/bearish histogram bars above/below the 0 line. Everything above 0 line = Strong Bullish Confirmation, and everything below 0 line = Strong Bearish Confirmation.
I like to use this with the MACD (Chris Moody's) or the RSI/Stochastic/ADX. On the chart above you can see that Tradingviews default VOT (Volume Over Time) indicator is applied to the chart with the MA option checked.
5 = green line
13 = red line
62 = purple line

FxASTLite Strategy[ALLDYN]This strategy can be used on ANY instrument (Forex, Stocks, Cryptocurrency, etc.) AND on ANY TF (Time Frame). The purpose of me sharing this is to show people the power of using a Fibonacci-based trading system combined with Institutional market looks and how associated price action reacts and responds at these levels within the market. This is nothing new with the work that Charles Dow did with the Dow Theory and what Ralph Nelson Elliott expanded upon with the Elliott Wave principle. It is about synergism and simplicity with what works. There is no "holy grail" in trading except the one between your ears. This is just a tool to give you a confirmation with multiple built-in confluences that can be tied with an oscillator for additional confluence.
It is helpful to know Supply & Demand Zones as well as candlestick patterns and where these reversal patterns happen within the market. They are more meaningful if they happen within Supply & Demand Zones. The 4 candlestick patterns I look for in Supply & Demand Zones are Hammer/Hanging Man (Pinbar), Engulfing Candle Pattern (blended lines), Dark Cloud Cover/Piercing Candle Pattern (blended lines), and Tweezer Tops/Bottoms.
I through The Ichimoku Cloud on top of this so you can see the transitions as the market moves in its fractal nature. I use the MACD, TDI, and RSI for confirmation of what associated price action is doing on the chart. I say associated price action because nothing happens without volume. There are some built-in Volume tools in TV that give some good insight into what is happening (overall volume - VPVR, at price - session volume, & overtime - vol. )
***PURPOSE of the RIBBON***:
-The Ribbon allows you to get in at the START/BEGINNING of a Correction/Trend Change (Associated price action should always be the ENTRY condition).
-If the associated price action stays above the Ribbon, then this allows you to stay in the BUY trade longer.
*Note - Exit of the BUY trade would be if associated price action BELOW the Ribbon.
-If associated price actions stay below the Ribbon, this allows you to stay in the SELL trade longer (Associated price action should always be the ENTRY condition).
*Note - Exit of the SELL trade would be if associated price action closed ABOVE the Ribbon.
***PURPOSE of the Oracle (Solid purple line)***
-The Oracle will act as Trend confirmation and associated price action target as the Trend is TRANSITIONING
***SYSTEM FEATURES***
-Inputs (Style, Visibility = NA):
You are able to toggle ALLDYN FxASTLite from the chart.
You are able to toggle PSARs from the chart.
You are able to toggle background (Affects White/Black line)
If you suffer from any type of Color Blindness you can select different options to help.
*****DISCLAIMER*****
I am not a financial advisor or commodity trade advisor. This "TOOL" is for EDUCATIONAL PURPOSES ONLY. Any use of this financial educational tool in ANY demo/live market you do so at your own RISKS. Trading in leveraged financial markets has inherent RISKS associated with such actions. Do Not Trade Money YOU Can't Afford to LOSE.