Profitable AroonIntroduction
The Aroon indicator was developed by well-known technical analyst Tushar Chande in 1995 and is used to identify trend changes in the price of an asset, as well as the strength of that trend. The fact that he named the indicator "Aroon" which is Sanskrit for "Dawn’s Early Light" demonstrates his belief in his indicator's trend discovery capabilities.
It is composed of two lines, Aroon Up and Aroon Down .
The most basic strategy is to use the crossovers as trade signals:
when Aroon Up crosses above Aroon Down , go Long
when Aroon Down crosses above Aroon Up , go Short
Exit when a crossover occurs in the opposite direction
What is this tool?
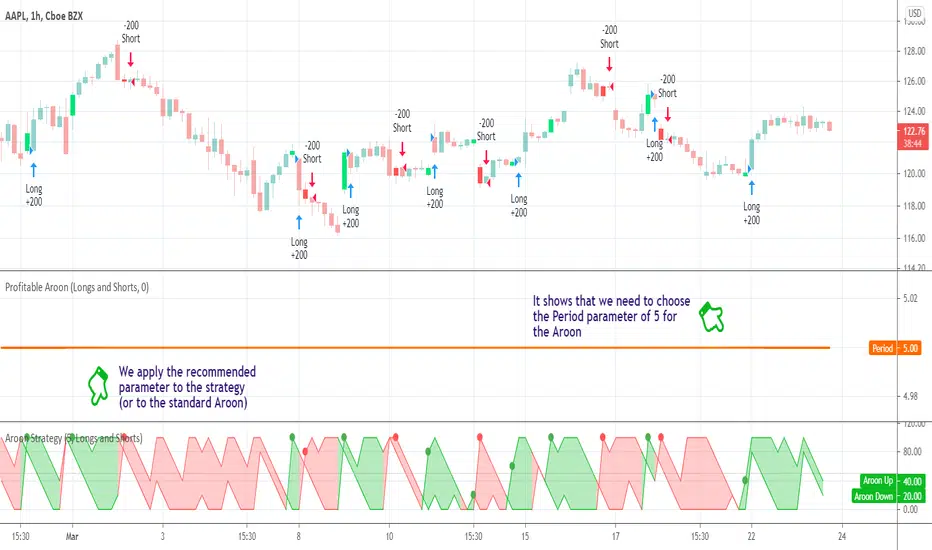
This tool is a performance scanner that uses a decision tree-based algorithm under the hood to find the most profitable period setting for the Aroon. It analyzes the range of periods between 2 to 100 and backtests the Aroon indicator for each period using the strategy mentioned above across the entire history of an instrument. If a more profitable parameter was found, the indicator will switch its value to the found one immediately.
Alerts
It has an alert that notifies when a more profitable period was found.
NOTE : It does not change what has already been plotted.
Good luck and Happy Trading!
Algorithm
Profitable Parabolic SARHello friends,
This script is a powerful, non-repainting optimizer for the classic Parabolic Stop and Reverse (PSAR) — one of J. Welles Wilder's most respected trend-following systems. It automatically finds and applies the most profitable PSAR settings for each instrument and timeframe, eliminating the need for manual parameter tuning.
🛠 How It Works
The indicator evaluates over 500 combinations of PSAR parameters using a decision tree–based algorithm under the hood .
Each configuration is backtested across the instrument's full price history, and when a more profitable setup is identified, the indicator seamlessly switches to those values in real time — while maintaining the original PSAR logic.
The Maximum parameter remains fixed since its impact on overall profitability is minimal compared to Start and Increment.
This self-adjusting approach removes the guesswork of parameter optimization and keeps the PSAR dynamically tuned to changing market regimes.
💡 Integrated Versions Explained
This all-in-one tool merges 3 complementary indicators:
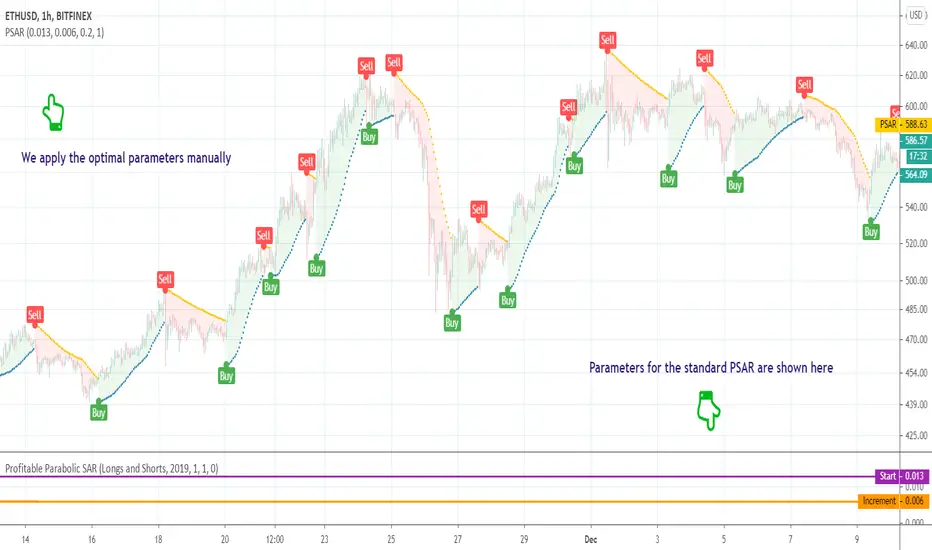
• Profitable PSAR — A parameter optimizer that runs in a separate window below your main chart. It doesn't generate buy/sell signals directly but analyzes your specific asset and timeframe to find optimal settings. These are displayed as two lines (purple and orange), with optional labels showing the actual parameter values. Once identified, you can apply these optimal values manually to the standard PSAR.
• Self-Adjusting PSAR — A real-time overlay version that looks and behaves like the standard PSAR but automatically adjusts its parameters on the fly. It requires no manual configuration and can be paired with the Profitable PSAR to monitor which settings are currently active.
• Compact Self-Adjusting PSAR — A minimalist oscillator version that reflects the same adaptive logic through simple binary outputs: -1 for Sell and 1 for Buy. This variant is ideal for filtering or signal integration into other systems.
Together, they form a unified adaptive system that gives users both automation and interpretability — the best of both worlds.
🔥 Key Features
Adaptive optimization powered by a decision tree–based algorithm
Real-time switching to more profitable parameter configurations
Direction filter (Longs | Shorts | Longs & Shorts)
Optional analysis start date for focused historical testing
Commission customization for realistic performance modeling
Visual highlighting of parameter changes
Optional buy/sell labels and compact trend signal display
If you'd like access or have any questions, feel free to reach out to me directly via DM.
👋 Good luck and happy trading!
유료 스크립트
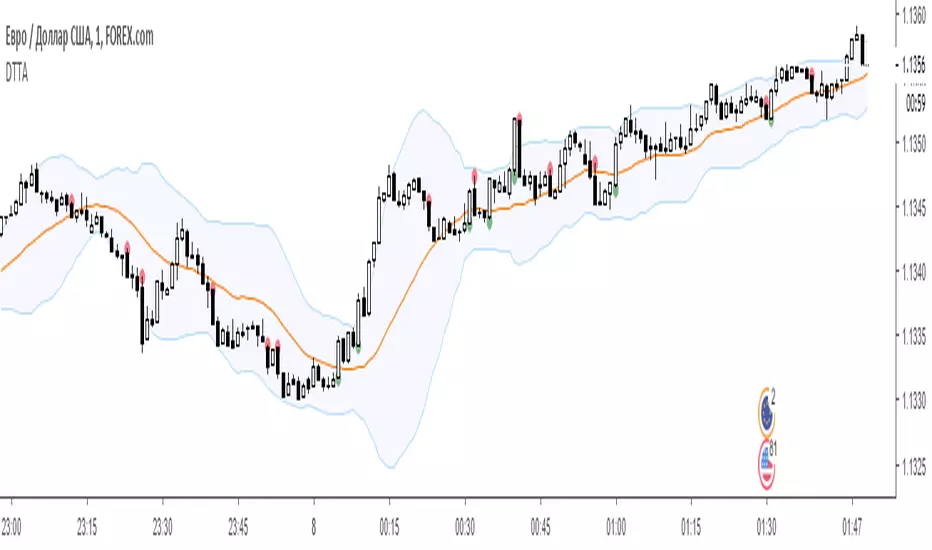
Dual Thrust Trading AlgorithmThe Dual Thrust trading algorithm is a famous strategy developed by Michael Chalek. It has been commonly used in futures, forex and equity markets. The idea of Dual Thrust is similar to a typical breakout system, however dual thrust uses the historical price to construct update the look back period - theoretically making it more stable in any given period.
Profitable Vortex Indicator ScannerIntroduction
The Vortex Indicator is a technical indicator invented by Etienne Botes and Douglas Siepman (Technical Analysis of Stocks & Commodities, V.28:1 (January, 2010): "The Vortex Indicator") to identify the start of a new trend or the continuation of an existing trend within financial markets.
It is composed of two lines, +VI and -VI . +VI represents up trending momentum and -VI represents down trending momentum.
The most basic strategy is to use the crossovers as trade signals:
when +VI crosses above -VI , go Long
when -VI crosses above +VI , go Short
Exit when a crossover occurs in the opposite direction
What is this tool?
This tool is a performance scanner that uses a decision tree-based algorithm under the hood to find the most profitable period's setting for the indicator. It analyzes the range of periods between 2 to 100 and backtests the Vortex Indicator for each period using the strategy mentioned above across the entire history of an instrument.
Settings
Net Profit line is optional and can be hidden through settings.
Alerts
It has an alert that notifies when a more profitable period was detected.
NOTE : It does not change what has already been plotted.
Good luck!

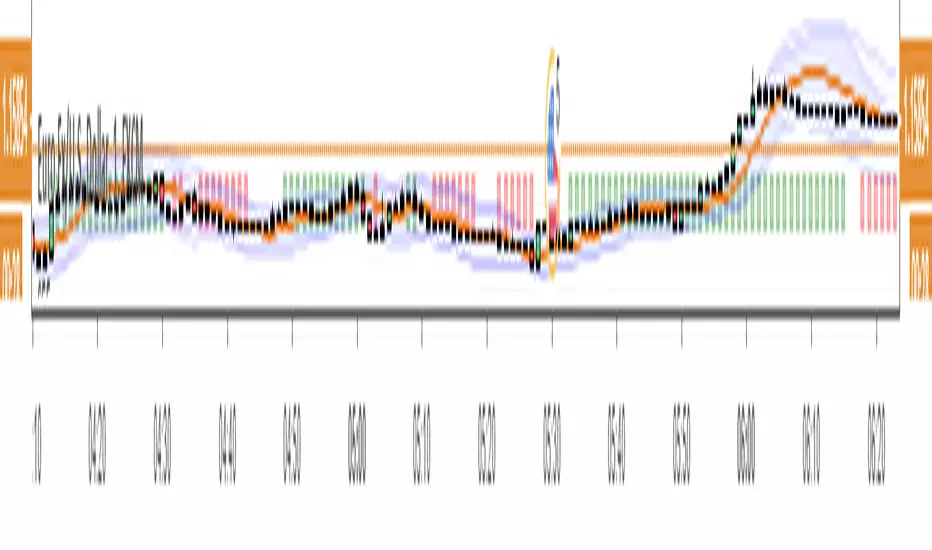
MTF Deviation - Mtrl_ScientistHi everyone,
There are a lot of possible ways to look at markets and find valid patterns.
This time, I've looked at how shorter time frames deviate from the overall price consensus.
What you're seeing here is a range-bound difference of the lowest time frame from the overall price consensus (baseline), represented as blue line.
When lower time frames agree with the baseline, the difference becomes 0.
Logically, this difference cannot deviate too much from the baseline, and to quantify that, I've added fib-levels based on a deviation percentage that depends on price volatility and can be adjusted in the settings.
How it works:
First of all, you need to switch to the 1min time frame to get access to the lowest time frame data.
Look at how the blue line follows the support/resistance fib levels.
Oversold conditions are usually given by entering the lowest red band, whereas overbought conditions are given by entering the upper red band.
However, there are also extreme cases, where the blue line exceeds the set fib levels. In that case, price will reverse with very high likelihood.
Alternatively you can also ping-pong between two fib levels for frequent small trades.
Note that this indicator doesn't use any security functions to access time frame data. Instead, I found a different way to avoid repainting.
At the moment I'm just playing around with this to see how I can improve it. Feedback is very welcome!

CryptoMedics Algorithmic Trading BandsCryptoMedics are happy to announce the release of our new Algorithmic trading bands!
The Bands can be used as dynamic support and resistance levels. Anything from scalping on the 1m chart to swing trading on the daily. The opportunities are endless.
Developed using tried and tested methods that hedge funds from wallstreet to smart individual traders have used for years now. Now all available to you.
Here is an example of scalping with it on the 3m chart on BCHZ18. If you would've used 10x leverage you would've made a total of 760%!
Examples:
Another example on XBTUSD using the bands to catch a swing trade
These results are undeniably good and I bet you can't find similar ones with any other indicator!

CryptoMedics Algorithmic Trading Bands CryptoMedics are happy to announce the release of our new Algorithmic trading bands!
The Bands are used as dynamic moving support and resistance levels and can be used for anything from scalping on low timeframes to swing trading larger moves.
An example of this would be if a coin pumped 20% and you're expecting it to go up more you wait for it to return to either the upper middle or one of the core bands and long it there.
The amount of usecases for this indicator is endless.
Developed using tried and proven methods that everyone from private individuals to wallstreet hedge funds have used. Now available to CryptoMedics subscribers.
The indicator works across any assets since it isn't based on any pair-specific data but rather more broad data that exists on all trading pairs.

TradeMiner S9This is the first TradingView indicator EVER to include dynamic support and resistance lines from upper or lower diagonal highs and lows in real-time.
Note: This indicator has been built using Pinescript V2
Like and Share for access and more awesome indicators!
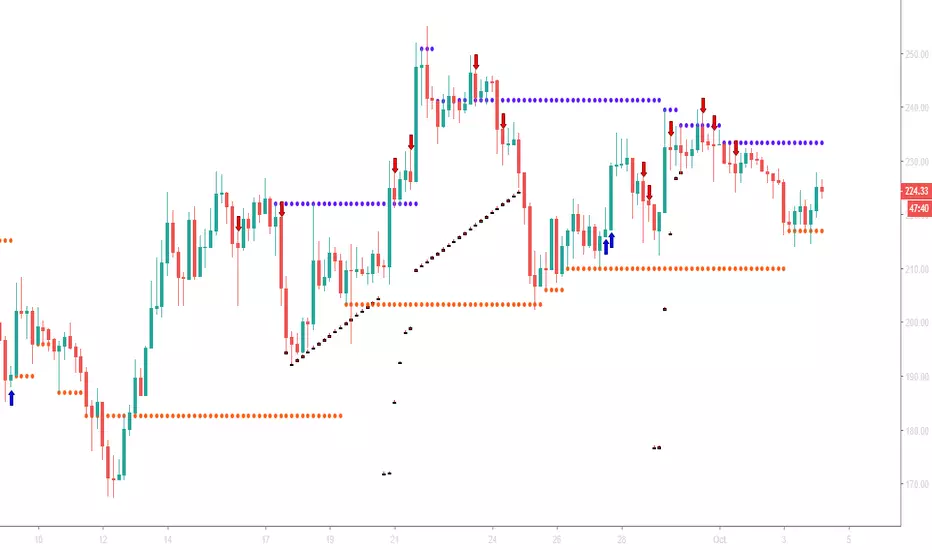
A blue arrow appears only in a red bar and under these conditions:
Closing Score Trigger (CS < 50)
On Balance Volume, Accumulation/Distribution, and Chaikin Money Flow Combination (OBV/AD /CMF > 0)
Chaikin Money Flow (CMF <-0.05)
A blue horizontal line will be drawn when CMF > 0.05 indicates a sale of the position.
A red arrow appears only in a green bar and under these conditions:
Closing Score Trigger (CS > 50)
On Balance Volume, Accumulation/Distribution, and Chaikin Money Flow Combination (OBV/AD/CMF < 0)
Chaikin Money Flow (CMF > 0.05)
A red horizontal line will be drawn when CMF <-0.05 indicates a sale of the position.
A new condition called " leaniency " has been added that allows all these conditions to be fulfilled within multiple bars so that the occurrence occurs more frequently. This will result in more signals appearing. Setting leniency to " 1 " means that all four conditions must occur in a single bar, while " 5 " means that all four conditions must occur within 5 bars.
Find lifetime access to the indicator here: www.kenzing.com
BTC
FTA 2.3This is the latest Version of FTA 2. It gets a separate script space to not disturb the 2.2 Users with the changes:
Revamped sells into one system again. It uses MFI and RSI from different periods to find better selling points. This has been a partial weakness of FTA 2.2 especially in downtrend.
Included Trailing-Stop with a third alert for people who like it
Included Take-Profit: Sell your given percentage above the last buy if you like (Not recommended with low percentages in crypto market*)
Finally added "sell" label above sell symbols
*Advanced Users may find Trailing-Stop in combination with a low-margin Take-Profit useful though. It can recreate Risk/Reward trading

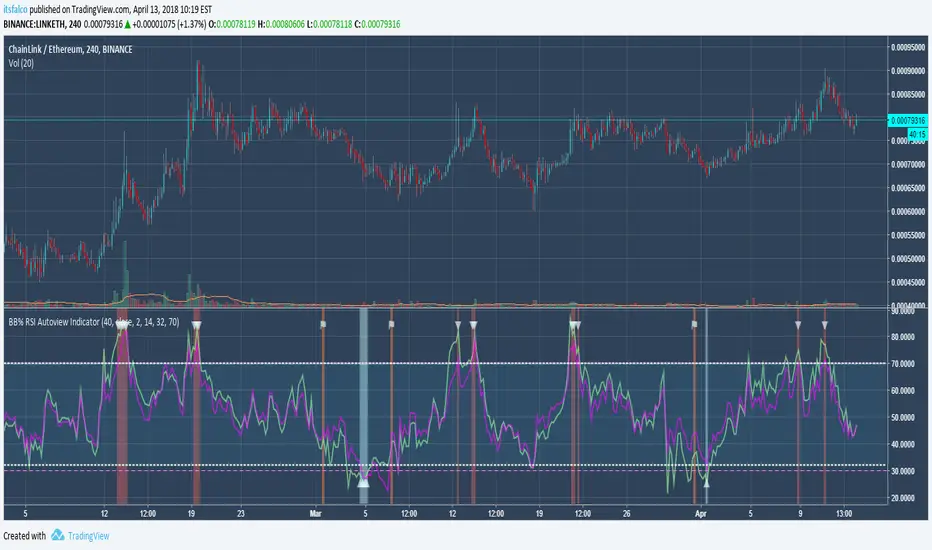
BB% RSI Autoview & Alert Signal Advanced Indicator 2.0
Version 2.0 Upload
Detail
This is a premium indicator that is intended for automated trading (eg. Autoview) on the 4 hour time scale. This script uses normalised Bollinger Band and RSI values to find greatly oversold/overbought territory. When a entry or exit has been identified, further conditions are checked to attempt to prevent entry into traps based on volume and price history . There are three alerts set up that can be used to either trigger an automated entry/exit of a trade or be used as a simple signal to manually make the trade if you don't have time to look at charts throughout the day.
Available Settings
RSI Length
RSI Oversold/Overbought thresholds
BB Length
BB Multiplication
Future developments
I am constantly tinkering with the indicator to make it better and even more reliable. Here are some features in the works:
A strategy version will be created for use in back-testing
Even more customisation regarding modifying BB% upper and lower thresholds
More conditions will be checked to improve the dip detector to maximise profits on the uptrend when OS conditions are more infrequent
Availability
Please PM me for a 24H free trial full access to the indicator to analyse its setting and visually backtest it against your desired markets.
Afterwards this indicator is available for a flat fee of 0.10 ETH for lifetime access, all future updates and full support from me at any time to help fine tune it.
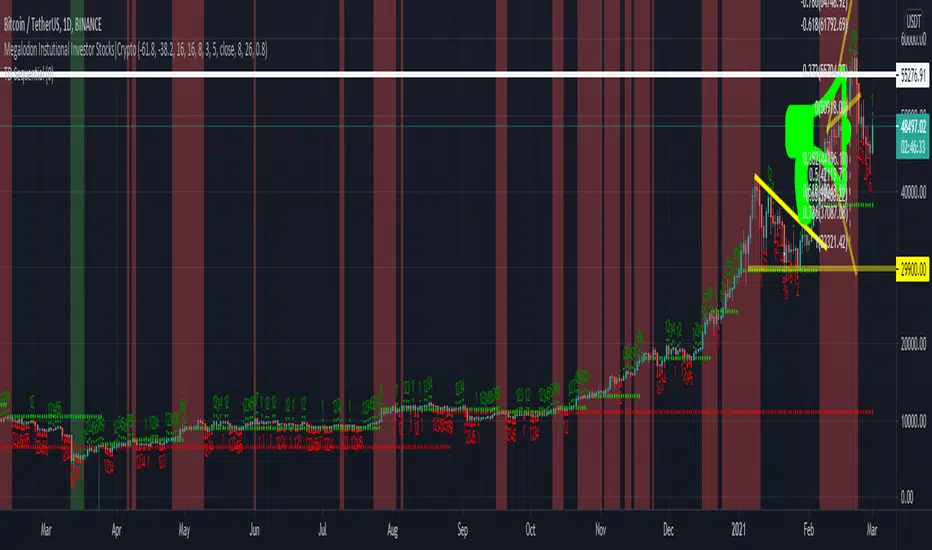
iPyra◬_theMegalodonTHEMEGALODON
theMegalodon looks for the institutional finger prints, the whales or the big boys.
theMegalodon is really simple to use.
theMegalodon combines the 8 different unique indicators, that each have almost perfect success rate.
theMegalodon works with any kind of market state, any kind of trading, and any kind of asset.
theMegalodon has more features than any other indicator in the market: Out of 9 working indicators, we have 3 momentum, 3 price and 3 volume indicators showing you the best signals.
--------------------------------------
theMegalodon is designed for us, the small fishes in the ocean, the millennials, the college students. This will basically makes us the new Megalodons(whale hunters).
All you have to do is:
1- Look for green or red arrows.
2- Look for orange or red candles.
3- Repeat
--------------------------------------
TECHNICAL DETAILS
Some boring info that you don't necessarily need to know.
1- Draws fibonacci retracement (s)' levels depending on your preferred look back period (Default: 365 and 120)
i) Can draw 2 fibs on the same chart. Can reverse the fib levels. Even, add an additional fib level to look for.
ii) Automatic fill function for a Reload Zone inside of a Reload Zone. *61.8% levels to 100% levels or 0% levels
2- Changes the color of the candle when strong buy(orange) or strong sell(red). Draws arrows on the chart for long and short positions.
i) Analyses and Combines
a) Price
b) Momentum
c) Volume
3- Prints out the indicators that are either giving Short or Long signs on the right corner.
4- The closer the unclebo indicator(click enable UncleBo) gets to the All time high, the better buy it is.
i) Same with the other way around. The closer it gets to the 0, the better sell it is.
5- Draws Bollinger Bands on the chart and shows where to buy or sell
6-The indicator is designed to be used in Daily time frame for the best calls to short or long.
--------------------------------------------------
iPyra◬
Enlighten others
Automatic Monthly Pivots with built-in Fibonacci LevelsClassic Floor Trader Pivots (algorithm decision points) with color segmented Fibonacci levels plotted in real-time Enjoy! Multi-variable Time Frame Pivots with Custom fib levels is in works.

FTA 2Hello there,
What you see here is V2 of FTA .
First of all some keypoints to it:
-It uses Gunbot
-Many Microtrades on a bullish market
-Even make Profit on Sideway & wavy downtrends
-Double up to infinity
-Controlled downtrend averaging
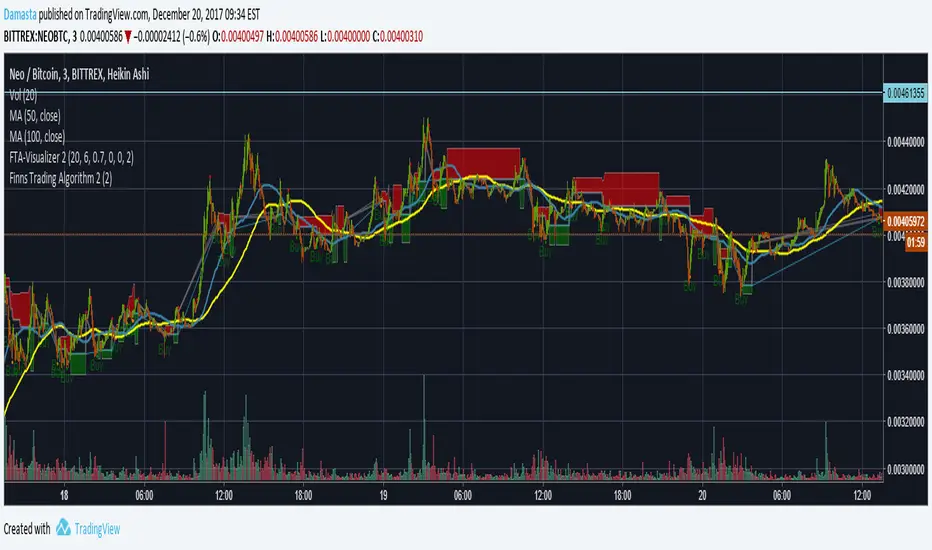
-Visualizer available allowing visible emulation of the Script & Gunbot trading together.
-More Features & Optimization still to come!
It has the same core as V1 but a few big changes/additions.
As I don't want to force these changes on to everyone I made an additional version.
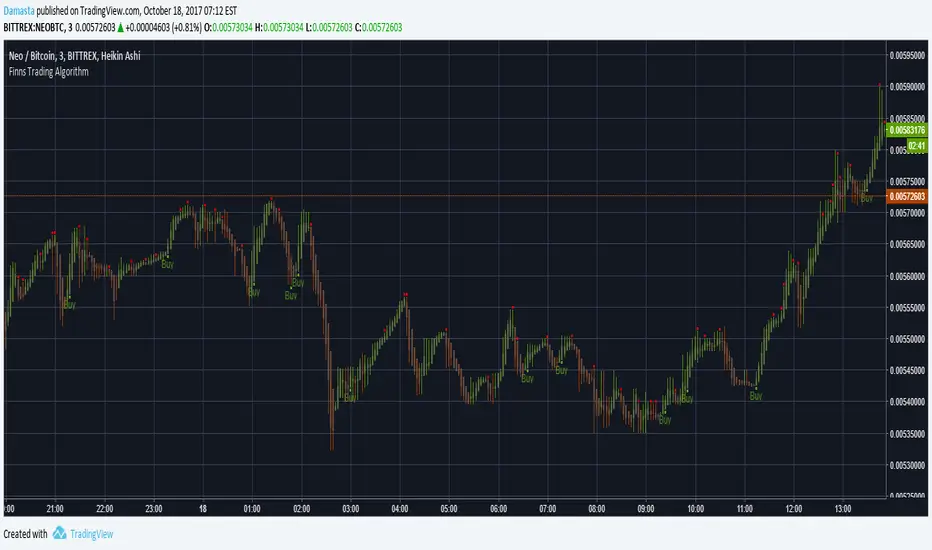
Finns Trading Algorithm AlertsHello there,
I have developed a Microprofit Script for Tradingview and would like to introduce you to it.
First of all some keypoints to it:
-It uses Gunbot
-Many Microtrades on a bullish market
-Even make Profit on Sideway & wavy downtrends
-Double up to infinity
-Controlled downtrend averaging
-Visualizer available allowing visible emulation of the Script & Gunbot trading together.
-More Features & Optimization still to come!
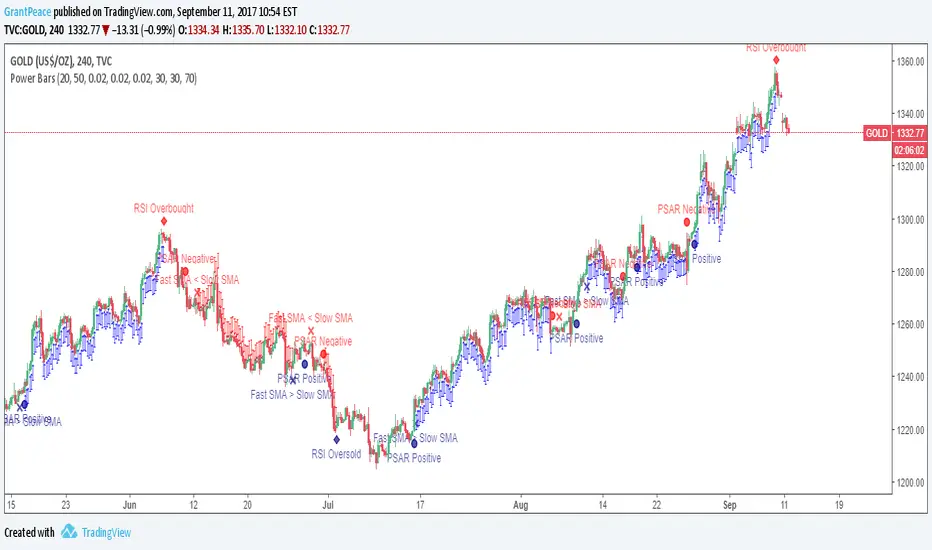
Power Bars This is the latest and greatest of technical analysis .
Values for your favourite indicators can easily be changed to customise your strategy.
When an indicator becomes bullish or bearish , a notification appears on the bar.
When all indicators align, Power Bars show up. Red Power Bars are bearish , blue Power Bars are bullish.
This is what the bars look like close-up.