Quantura - Quantitative AlgorythmIntroduction
“Quantura – Quantitative Algorithm” is an invite-only Pine Script strategy designed for multi-timeframe analysis, combining technical filters with user-adjustable fundamental sentiment. It was primarily developed for cryptocurrency markets but can also be applied across other assets such as Forex, stocks, and indices. The goal is to generate structured trade signals through a confluence of techniques rather than relying on a single indicator.
Originality & Value
Quantura is not a simple mashup of indicators. Its originality comes from how multiple layers of analysis are integrated into a single decision framework . Instead of showing indicators separately, the strategy only issues trades when several conditions align simultaneously:
RSI entry triggers confirm overbought/oversold reversals.
Market structure on a higher timeframe confirms trend direction.
Order block detection highlights zones of concentrated supply and demand.
Premium/Discount zones identify potential over- and undervaluation.
HTF EMA provides trend confirmation.
Optional candlestick patterns strengthen reversal or continuation signals.
An optional correlation filter compares the main asset to a reference instrument.
This design forces agreement between different methodologies (momentum, structure, value, volume, sentiment), which reduces noise compared to using them in isolation.
Functionality & Indicators
Entry trigger: RSI exits from extreme zones.
Filters: Only valid when all selected filters (HTF structure, EMA, order blocks, premium/discount, candlesticks, correlation, volume) confirm the direction.
Fundamental bias: User-defined sentiment and analysis settings (bullish, bearish, neutral) influence whether long or short trades are permitted.
Exits: ATR-based take profit and stop loss, with optional breakeven, opposite-signal exit, and session-end exit.
Visualization: Buy/Sell markers, trend-colored candles, and an optional dashboard summarizing indicator status.
Parameters & Customization
Timeframes: Independent HTF and LTF selection.
Trading direction: Long / Short / Both.
Session and weekday filters.
RSI length and thresholds.
Filters: HTF structure, order blocks, premium/discount, EMA, candlestick, ATR volatility, volume zones, correlation.
Exit rules: ATR multipliers for TP/SL, breakeven logic, session-end exit, opposite-signal exit.
Visuals: Toggle signals, candles, dashboard, custom colors.
Default Properties (Strategy Settings)
Initial Capital: 100,000 USD
Position Size: 15% of equity per trade
Commission: 0.25%
Slippage: enabled
Pyramiding: 0 (one position at a time)
Note: The position sizing of 15% equity per trade is intentionally set for backtesting demonstration. In real trading, risking this much is considered aggressive. Most traders prefer to risk 1-5% of equity, and rarely above 10%.
Backtesting & Performance
Backtests on BTCUSD (2 years) with the above defaults showed:
112 trades
Win rate: 40%
Profit factor: 1.4
Maximum drawdown: 34%
These results illustrate how the confluence model behaves, but they are not predictive of future performance . The trade sample size (72 trades) is below the 100+ usually recommended for statistical robustness. Users should re-test with their own preferred symbols, settings, and timeframes.
Risk Management
ATR-based stops and targets scale with volatility.
Commission and slippage are included by default for realistic modeling.
Opposite-signal exit helps capture trend reversals.
Session-end exit can close intraday positions before illiquid hours.
Breakeven option protects profits when available.
Although the default allocation uses 15% per trade for demonstration, this is not a recommendation. Users are encouraged to adjust risk sizing downwards to sustainable levels (commonly 1-5%).
Limitations & Market Conditions
Performs best in volatile, liquid markets (e.g., crypto).
May struggle in prolonged sideways markets with low volatility.
News events and fundamentals outside user inputs can override signals.
Backtests below 100 trades should be considered exploratory, not statistically conclusive.
Usage Guide
Add “Quantura – Quantitative Algorithm” to your chart in strategy mode.
Select HTF and LTF timeframes, trading direction, and session filters.
Configure confluence filters (structure, EMA, order blocks, premium/discount, candlestick, correlation, volume).
Set sentiment and analysis bias in fundamental settings.
Adjust ATR multipliers and exits.
Review buy/sell signals and analyze performance in the Strategy Tester.
Author & Access
Developed 100% by Quantura . Distributed as an Invite-Only script . Details are provided in the Author’s Instructions field.
Important: This description complies with TradingView’s Script Publishing Rules and House Rules. It does not guarantee profitability, avoids unrealistic claims, and explains how the strategy integrates multiple methods into a coherent decision framework.
Algorithm

Aurum DCX AVE Gold and Silver StrategySummary in one paragraph
Aurum DCX AVE is a volatility break strategy for gold and silver on intraday and swing timeframes. It aligns a new Directional Convexity Index with an Adaptive Volatility Envelope and an optional USD/DXY bias so trades appear only when direction quality and expansion agree. It is original because it fuses three pieces rarely combined in one model for metals: a convexity aware trend strength score, a percentile based envelope that widens with regime heat, and an intermarket DXY filter.
Scope and intent
• Markets. Gold and silver futures or spot, other liquid commodities, major indices
• Timeframes. Five minutes to one day. Defaults to 30min for swing pace
• Default demo used in this publication. TVC:GOLD on 30m
• Purpose. Enter confirmed volatility breaks while muting chop using regime heat and USD bias
• Limits. This is a strategy. Orders are simulated on standard candles only
Originality and usefulness
• Unique fusion. DCX combines DI strength with path efficiency and curvature. AVE blends ATR with a high TR percentile and widens with DCX heat. DXY adds an intermarket bias
• Failure mode addressed. False starts inside compression and unconfirmed breakouts during USD swings
• Testability. Each component has a named input. Entry names L and S are visible in the list of trades
• Portable yardstick. Weekly ATR for stops and R multiples for targets
• Open source. Method and implementation are disclosed for community review
Method overview in plain language
You score direction quality with DCX, size an adaptive envelope with a blend of ATR and a high TR percentile, and only allow breaks that clear the band while DCX is above a heat threshold in the same direction. An optional DXY filter favors long when USD weakens and short when USD strengthens. Orders are bracketed with a Weekly ATR stop and an R multiple target, with optional trailing to the envelope.
Base measures
• Range basis. True Range and ATR over user windows. A high TR percentile captures expansion tails used by AVE
• Return basis. Not required
Components
• Directional Convexity Index DCX. Measures directional strength with DX, multiplies by path efficiency, blends a curvature term from acceleration, scales to 0 to 100, and uses a rise window
• Adaptive Volatility Envelope AVE. Midline ALMA or HMA or EMA plus bands sized by a blend of ATR and a high TR percentile. The blend weight follows volatility of volatility. Band width widens with DCX heat
• DXY Bias optional. Daily EMA trend of DXY. Long bias when USD weakens. Short bias when USD strengthens
• Risk block. Initial stop equals Weekly ATR times a multiplier. Target equals an R multiple of the initial risk. Optional trailing to AVE band
Fusion rule
• All gates must pass. DCX above threshold and rising. Directional lead agrees. Price breaks the AVE band in the same direction. DXY bias agrees when enabled
Signal rule
• Long. Close above AVE upper and DCX above threshold and DCX rising and plus DI leads and DXY bias is bearish
• Short. Close below AVE lower and DCX above threshold and DCX falling and minus DI leads and DXY bias is bullish
• Exit and flip. Bracket exit at stop or target. Optional trailing to AVE band
Inputs with guidance
Setup
• Symbol. Default TVC:GOLD (Correlation Asset for internal logic)
• Signal timeframe. Blank follows the chart
• Confirm timeframe. Default 1 day used by the bias block
Directional Convexity Index
• DCX window. Typical 10 to 21. Higher filters more. Lower reacts earlier
• DCX rise bars. Typical 3 to 6. Higher demands continuation
• DCX entry threshold. Typical 15 to 35. Higher avoids soft moves
• Efficiency floor. Typical 0.02 to 0.06. Stability in quiet tape
• Convexity weight 0..1. Typical 0.25 to 0.50. Higher gives curvature more influence
Adaptive Volatility Envelope
• AVE window. Typical 24 to 48. Higher smooths more
• Midline type. ALMA or HMA or EMA per preference
• TR percentile 0..100. Typical 75 to 90. Higher favors only strong expansions
• Vol of vol reference. Typical 0.05 to 0.30. Controls how much the percentile term weighs against ATR
• Base envelope mult. Typical 1.4 to 2.2. Width of bands
• Regime adapt 0..1. Typical 0.6 to 0.95. How much DCX heat widens or narrows the bands
Intermarket Bias
• Use DXY bias. Default ON
• DXY timeframe. Default 1 day
• DXY trend window. Typical 10 to 50
Risk
• Risk percent per trade. Reporting field. Keep live risk near one to two percent
• Weekly ATR. Default 14. Basis for stops
• Stop ATR weekly mult. Typical 1.5 to 3.0
• Take profit R multiple. Typical 1.5 to 3.0
• Trail with AVE band. Optional. OFF by default
Properties visible in this publication
• Initial capital. 20000
• Base currency. USD
• request.security lookahead off everywhere
• Commission. 0.03 percent
• Slippage. 5 ticks
• Default order size method percent of equity with value 3% of the total capital available
• Pyramiding 0
• Process orders on close ON
• Bar magnifier ON
• Recalculate after order is filled OFF
• Calc on every tick OFF
Realism and responsible publication
• No performance claims. Past results never guarantee future outcomes
• Shapes can move while a bar forms and settle on close
• Strategies use standard candles for signals and orders only
Honest limitations and failure modes
• Economic releases and thin liquidity can break assumptions behind the expansion logic
• Gap heavy symbols may prefer a longer ATR window
• Very quiet regimes can reduce signal contrast. Consider higher DCX thresholds or wider bands
• Session time follows the exchange of the chart and can change symbol to symbol
• Symbol sensitivity is expected. Use the gates and length inputs to find stable settings
Open source reuse and credits
• None
Mode
Public open source. Source is visible and free to reuse within TradingView House Rules
Legal
Education and research only. Not investment advice. You are responsible for your decisions. Test on historical data and in simulation before any live use. Use realistic costs.

Script_Algo - High Low Range MA Crossover Strategy🎯 Core Concept
This strategy uses modified moving averages crossover, built on maximum and minimum prices, to determine entry and exit points in the market. A key advantage of this strategy is that it avoids most false signals in trendless conditions, which is characteristic of traditional moving average crossover strategies. This makes it possible to improve the risk/reward ratio and, consequently, the strategy's profitability.
📊 How the Strategy Works
Main Mechanism
The strategy builds 4 moving averages:
Two senior MAs (on high and low) with a longer period
Two junior MAs (on high and low) with a shorter period
Buy signal 🟢: when the junior MA of lows crosses above the senior MA of highs
Sell signal 🔴: when the junior MA of highs crosses below the senior MA of lows
As seen on the chart, it was potentially possible to make 9X on the WIFUSDT cryptocurrency pair in just a year and a half. However, be careful—such results may not necessarily be repeated in the future.
Special Feature
Position closing priority ❗: if an opposite signal arrives while a position is open, the strategy first closes the current position and only then opens a new one
⚙️ Indicator Settings
Available Moving Average Types
EMA - Exponential MA
SMA - Simple MA
SSMA - Smoothed MA
WMA - Weighted MA
VWMA - Volume Weighted MA
RMA - Adaptive MA
DEMA - Double EMA
TEMA - Triple EMA
Adjustable Parameters
Senior MA Length - period for long-term moving averages
Junior MA Length - period for short-term moving averages
✅ Advantages of the Strategy
🛡️ False Signal Protection - using two pairs of modified MAs reduces the number of false entries
🔄 Configuration Flexibility - ability to choose MA type and calculation periods
⚡ Automatic Switching - the strategy automatically closes the current position when receiving an opposite signal
📈 Visual Clarity - all MAs are displayed on the chart in different colors
⚠️ Disadvantages and Risks
📉 Signal Lag - like all MA-based strategies, it may provide delayed signals during sharp movements
🔁 Frequent Switching - in sideways markets, it may lead to multiple consecutive position openings/closings
📊 Requires Optimization - optimal parameters need to be selected for different instruments and timeframes
💡 Usage Recommendations
Backtest - test the strategy's performance on historical data
Optimize Parameters - select MA periods suitable for the specific trading instrument
Use Filters - add additional filters to confirm signals
Manage Risks - always use stop-loss and take-profit orders.
You can safely connect to the exchange via webhook and enjoy trading.
Good luck and profits to everyone!!

Volatility Compression Breakout - LeafAlgo Pro StrategyThe Volatility Compression Breakout strategy is designed to identify periods of low volatility followed by potential breakout opportunities in the market. It aims to capture moments when the price consolidates within a narrow range, indicating a decrease in volatility, and anticipates a subsequent expansion in price movement. This strategy is based on our indicator of the same name (), but differs by offering many more options for the band/channel type and trend filters in addition to implementing the ability to use this strategy with algorithmic plug-ins (see details at the bottom).
This strategy features six types of bands/channels and five types of trend filters, for a total of 30 combinations. The six band/channel types are the Adaptive Gaussian MA channel (based on the Adaptive Gaussian MA that we previously published ()), standard Bollinger Bands, smoothed Bollinger Bands (basis is an EMA of the typical Bollinger Basis), Keltner Channels, a Quadratic Regression Channel (based on the channel that we previously published in the LeafAlgo Pro indicator ()), and Volatility-Based Mean Reversion Bands (). The five trend filters include an EMA, SMA, Weighted MA, McGinley Dynamic, and the Adaptive Gaussian MA itself.
Examples of the different band/channel types (all with EMA as the trend filter):
Adaptive Gaussian MA Channel:
Bollinger Bands:
Smoothed Bollinger Bands:
Keltner Channels:
Quadratic Regression Channel:
Volatility-Based Mean Reversion Bands:
Examples of the different trend filters (all with Keltner Channels):
EMA:
SMA:
WMA:
McGinley Dynamic:
Adaptive Gaussian MA:
How the Long/Short Entry Signals are Calculated:
A breakout signal upwards, accompanied by a long entry, is created when the high is greater than the secondary upper band (the upper band plus a standard deviation or with a multiplier, depending on which band/channel type is selected), the latest close is above the trend filter line, and the previous close was below the trend filter line. A break downwards, accompanied by a short entry, is created when the low is below the secondary lower band, the close is below the trend filter line, and the previous close was above the trend filter line. These conditions, along with a confirmed barstate, make up the strategy entry signals.
Coloration:
When the close price is above both the middle/basis and the trend filter, the bars are colored lime green, indicating a potential bullish market sentiment. When the close price is positioned above the basis but below the trend filter, or below the basis but above the trend filter, the bars are colored yellow, signifying a neutral or indecisive market condition. Conversely, when the close price falls below both the basis and the trend filter, the bars are colored fuchsia, suggesting a potential bearish market sentiment. Additionally, the coloration of the middle/basis line and the trend filter provides further visual cues for assessing the trend. When the close price is above the basis, the line is colored lime green, indicating a bullish trend. Conversely, when the close price is below the basis, the line is colored fuchsia, highlighting a bearish trend. Similarly, the trend line is colored lime green when the close price is above it, representing a bullish trend, and fuchsia when the close price is below it, indicating a bearish trend. The fill between the primary and secondary upper bands is colored lime and the fill between the primary and secondary lower bands is colored fuchsia. These colorations can be toggled on/off in the strategy settings menu.
How Changing Parameters Can Be Beneficial:
Modifying the parameters allows you to adapt the indicator to different market conditions and trading styles. For example, with Keltner Channels, increasing the compression period can help identify broader volatility patterns and major market shifts. On the other hand, decreasing the compression period provides more precise and timely signals for short-term traders. Adjusting the compression multiplier affects the width of the Keltner Channels. Higher multipliers increase the breakout threshold, filtering out smaller price movements and providing more reliable signals during significant market shifts. Lower multipliers make the indicator more sensitive to smaller price ranges, generating more frequent but potentially less reliable signals.
Changing the type of trend filter can drastically change your results. Test out each trend filter type and determine which one will work best for your purposes. Further, the MA periods in the trend filter settings can help you align your trades with the prevailing market direction. Increasing the period smoothes out the trend, filtering out shorter-term fluctuations and focusing on more sustained moves. Decreasing the period allows for quicker responses to changes in trend, capturing shorter-term price swings.
By adjusting the parameters and incorporating additional analysis techniques, you can customize the strategy to suit your trading style and preferences. However, it is crucial to exercise caution, conduct thorough analysis, and practice proper risk management to increase the likelihood of successful trades. Remember that no strategy can guarantee profits, and continuous learning and adaptation are key to long-term trading success.
Take Profit/Stop Loss Settings:
Take profit, stop loss, and trailing percentages are also included, found at the bottom of the Input tab under “TT and TTP” as well as “Stop Loss”. The take profit and stop loss levels will be reflected as green and red lines respectively on the chart as they occur. Make sure to understand the TP/SL ratio that you desire before use, as the desired hit rate/profitability percentage will be affected accordingly. The option for adding in a trailing stop has also been included, with options to choose between an ATR-based trail or a percentage-based trail. This strategy does NOT guarantee future returns. Apply caution in trading regardless of discretionary or algorithmic. Understand the concepts of risk/reward and the intricacies of each strategy choice before utilizing them in your personal trading.
Profitview/Pineconnector Settings:
If you wish to utilize Profitview’s automation system, find the included “Profitview Settings” under the Input tab of the strategy settings menu. If not, skip this section entirely as it can be left blank. Options will be “OPEN LONG TITLE”, “OPEN SHORT TITLE”, “CLOSE LONG TITLE”, and “CLOSE SHORT TITLE”. If you wished to trade SOL, for example, you would put “SOL LONG”, “SOL SHORT”, “SOL CLOSE LONG”, and “SOL CLOSE SHORT” in these areas. Within your Profitview extension, ensure that your Alerts all match these titles. To set an alert for use with Profitview, go to the “Alerts” tab in TradingView, then create an alert. Make sure that your desired asset and timeframe are currently displayed on your screen when creating the alert. Under the “Condition” option of the alert, select the strategy, then select the expiration time. If using TradingView Premium, this can be open-ended. Otherwise, select your desired expiration time and date. This can be updated whenever desired to ensure the strategy does not expire. Under “Alert actions”, nothing necessarily needs to be selected unless so desired. Leave the “Alert name” option empty. For the “Message”, delete the generated message and replace it with {{strategy.order.alert_message}} and nothing else. If using Pineconnector, follow the same directions for setting up an alert, but use the ",buy,,risk=" syntax as noted in the tooltips.
Additional Sample Settings (for ETHUSDT-Binance 45M):
Band/Channel Type - Keltner Channels (Compression Period of 20, Multiplier of 1.8x)
Trend Filter - WMA (50 length, no offset, close as the source)
TP/SL - 3.0% TP / 2.0% SL, 0.005 trailed TP, no trailed SL

Cloud X MesoHello there fellow Traders!
Thanks for stopping by, so today I will be covering everything you need to to know about this TradingView strategy.
Below I will discuss everything you need to know about this strategy so you can get a full grasp of what the strategy is, the features, what it does, how it works, the benefits of how this strategy can help you, and the results.
What is Cloud X Meso?
-Cloud X Meso is a strategy that consists of 7 indicators to all line up for total confluence to take a buy or sell once all 6 indicators conditions are met. This strategy does not repaint and doesn't require any technical analysis to be used. The strategy can be used on any timeframe, and any instrument.
-I have optimized many different variations for different types of trading instruments of this strategy ready to be used. The difference of this strategy is that these variations do not need any reoptimization to keep up with recent market conditions since there are hardly any inputs used, which prevents common overfitting problems. The main goal was for this strategy to be automated, as well as plug and play or you can officially consider this as set and forever forget.
What does this strategy do?
-The main goal for this strategy is to catch long or short term trends by waiting for all 7 indicators to line up as well as using customized trading times to trade certain sessions where there is high amounts of volume in the market. This strategy doesn't always need to have a clear trending market, since it can also catch short term trends in choppy markets as well. Overall, the strategy tell you when it buys, sells, and exits after all conditions are met.
How does the strategy work?
-The way that this strategy works is when all of the indicators confluences are met. Next, a buy or sell label will print and the candles colors will color blue or red to show that the trade is in the buy or sell position followed along with a magenta colored line which is the trailing stop to follow the trade until the trade exits from the trailing stop being hit or if the strategies exit condition is met.
-The strategy does have a set Take Profit target since it relies on the trailing stop to end the trade. This is beneficial so you can catch any size of a trend move when the strategy is in high volume market sessions. You catch these trends by customizing the settings to toggle on or off certain indicators, functions, configuring a customized trading time, and toggling on or off certain trading days to make a specific approach for fine tuning a pair to trade in a certain time window with high amounts of volume to catch trending moves whether it be a long or short term trend.
Below I will explain each functionality of the strategy for you to better understand the different ways you can adjust the settings of this strategy.
Backtest Settings:
-You can use these settings to determine a start / end date of what results you would like to see in the strategy tester.
-You can determine the $ amount you would like to see on strategy testers results to be in terms of net profit and max drawdown.
-You can choose whether you want the strategy to take buys only, sells only, or buys and sells.
Automation:
-Compatible with Pine Connectors to fully automate this strategy for MT4/5
-It uses a % based risk when placing trades so you won't have to calculate a proper lot size or dollar amount.
-You can also put the symbol of what that strategy will be trading on so you know what pair its trading.
Custom Trading Times:
-When you customize a trading time for the strategy to trade in, the background will turn blue for that specific time window, and you can use the "Session Exit" function to have trades close once the time window ends when toggled on, or you can have the existing trades close on their own when "Session Exit" is toggled off.
Dynamic Trailing:
-The algorithm uses a volatility based indicator to determine proper stop loss placement depending on how volatile the market is. This will prevent you from guesstimating if your stop loss is too big or too small.
-When Dynamic trailing is off, then the strategy will use a Risk Reward based stop loss to trail everytime the trades hits a new Risk Reward target.
-You can also toggle on or off for the stop loss to go to break even once the trade hits a 1:1 Risk Reward.
Directional Bias Settings:
-This indicator is the main directional bias that uses a multi timeframe function to determine the directional bias, you can also use the Exponential Moving Average as a form of directional bias instead, or you can use both of them to work together to find the directional bias. You can also toggle each one on or off
Entry / Exit Settings:
-This indicator also uses a multi timeframe function but it determines the entry and exit for a trade when all confluences are met. You can also toggle the entry and exit functions on or off.
1 Candle Rule:
-This feature is inspired by No Nonsense Forex (NNFX) the main function of this is if your entry doesn't meet all the entry conditions, then the strategy will wait 1 more candle to meet all the entry conditions to take a trade.
No Trade Zone:
-This feature will uses a Volume based indicator to filter out low volume markets. The candles will turn grey to indicate the algorithm not to take trades, and you can also customize the sensitivity of how strong this indicator will filter out the low volume in the markets.
Indicator functions
Each indicator plays a certain role and also meets certain conditions when a buy or sell trade is placed. I will reveal 3 out of 7 of the indicators used to preserve the uniqueness of this strategy but overall, the logic of this strategies main goal is to ride long or short terms trends while getting dynamic Risk Reward trades.
-The first indicator that the strategy uses an Exponential Moving Average that is customizable, and is used as a form of a filter for either a long or short term directional bias to filter out false signals to help the algorithm trade with the trend.
-The second indicator that the strategy uses is an Oscillator which is the Wavetrend and this indicators functionality for the algorithm is used for the its buy and sell signals to line up with all the other indicators for confluence. This indicator can also be toggled on or off for you own preference
-The third indicator used is the Volume indicator, and this is used to give the other indicators the green light to enter a trade if there are high amounts of volume in the market.
What are the benefits of using this algorithm?
Stress Free Trading:
-Once automated, you will no longer need to stare at the charts all day, as well as trying to execute the trades on time or worried that you missed a setup. Or you can choose to take trades manually when a buy or sell signal comes up
Stress Free Risk Management:
-All you have to do is provide a risk % and the algorithm will do the rest of the work calculating the stop loss, exiting trades, etc. No more needing to find the right lot size, or dollar amount, all in all the strategy will manage the trades for you.
Psychology:
-when you choose to have a systematic trading approach, it eliminates a lot bad habits from human nature
What are the results like?
-I have multiple different variations of results of this strategy, but I will share one of the results.
Here is a screenshot below of what this strategy can do from just one of the variations.
The backtest below was done with another variation on simulating a 100k account risking 0.50% per trade.
Thank you for taking the time to read through this whole guide, and I hope this helped you better understand the strategy.

Crypto Tipster v2---------------------
Crypto Tipster v2
Hello again! We're back with a drastically improved Crypto Tipster v2 Indicator using over a dozen all new algorithms based around Technical Analysis, Price Action, Momentum Swings and Reversal Detection.
We've taken our time with version 2 of Crypto Tipster, putting all our best practices to work and ensuring it performs superbly across numerous crypto markets and timeframes - we have focused our efforts towards the larger timeframes, 12H, 1D, 2D for example as we believe these to be the most consistent and predictable, and therefore the most profitable.
Trading on longer timeframes also reduces the overal cost of trading fee's as you'll be placing fewer trades over any given time period, whilst catching bigger swings and therefore earning a higher percentage per winning trade. Due to these bigger price swings you can de-leverage your trades too, making them inherintly safer and more controlled.
The final benefit to placing trades on longer timeframes is that you will not be tied down to your PC or laptop for hours on end waiting for a perfect entry or exit point, which increases the odds of placing bad/panic trades or even placing trades due to boredom! If you trade with Crypto Tipster v2 on a 1D timeframe, you will only ever have work to do once per day, at bar close; this is when trades are placed or exited, or stop losses/take profits are updated to new levels - easy!
Crypto Tipster v2 can help consistently catch tops and bottoms of trending markets whilst avoiding placing trades through choppy or ranging areas, this helps to not only maximise profits (what we're all after!) but also to minimise losses (equally important). We've tirelessly tested Crypto Tipster using literally thousands of variables across dozens of built-in algorithms over hundreds of trading pairs - lots of data to process!
The outcome is rather stunning and well worth checking out - we're rather proud of what we've achieved here, and we're pretty sure you're going to love it too!
---------------------
What's Included
- Chart Settings
The first section you'll come across, Chart Settings.
Here you'll find a few options regarding how your chosen market chart will look within TradingView and how Crypto Tipster will interact with this chart.
One of the most important Tick boxes is first on the list - "Show Backtest Results". This will change Crypto Tipster from displaying simple but easy-to-follow "Buy/Sell" labels into Strategy mode in which you can set up more complicated Stop Loss / Take profit settings as well as setting up Alerts for auto trading and other more complex functions (see How It Works for more info!
We've also included a "Trend Strength Bar Color" tick box which changes the color of the chart bars based on how strong Crypto Tipster is perceiving the current trend and in which direction.
- Trend Settings
"Trading Frequency" represents how often Crypto Tipster will be looking for a new trend / change in trend direction, and therefore how often it will be placing trades. By default this is set to "Normal" but can be changed to "Rapid" using the drop down menu.
"Entry Trend Strength" also determines how frequently trades are placed by selecting the strength of trend required before a trade is placed. The scale ranges from "1-5", with 1 being a low trend strength required, 5 being a very strong trend strength required.
Within the Trend Settings section you'll also find an "Avg Trend Strength over Bars" option. This allows you to average (mean) the current trend strength over a pre-determined amount (1-5) of previous chart bars - thus providing a potentially more consistent signal.
- Trade Settings
Trade Settings help Crypto Tipster determine what type of trades you're looking to place.
The overall "Trade Direction" will decide to either target only Long trades, only Short trades, or Both (default).
"Consecutive Trades in Same Direction" allows for pyramiding - whereby you can specify to allow for multiple trades of the same direction. Set to "1" as default allows for no extra pyramiding, max setting of "10".
- Trade Protection
Currently consisting of two functions, our Trade Protection section can help to achieve both the removal of false signals (whipsaws), and the extension of good trades without confusion during minor retracements.
"Chop Removal" can help to remove some whipsaw trades during ranging market conditions, therefore improving overal profitability by only targeting stronger trends. You have an option to choose from either "Weak" or "Strong" Chop Removal.
"Protection Filter" uses current trading criteria as defined by you, and uses it to check against a higher time frame than you're currently viewing. This can help to eliminate some bad trades at the expense of a potential lag on good trades.
- Stop Loss / Take Profit
Stop Losses should be a crucial aspect of everyone's trading system. They help prevent any trade from going too far in the wrong direction and limit losses.
Our "Stop Loss (%)" is quick and easy to set up, simply set the percentage offset from the entry price of trades and a fixed Stop Loss will be in place on all trades.
"Take Profit (%)" works in the same way as the Stop Loss mentioned above - simply set the percentage you'd like to exit a profitable trade at.
The "Trailing Stop (%)" is a little more complicated in that it will follow the trend of the trade a certain percentage away from the current market price - this is great for keeping yourself in a trade for as long as the trade is moving in the right direction.
- Extra Tools & Indicators
This is the section of Crypto Tipster that enables you to add some chart visuals to assist you with your preferred trading style.
"Potential Pivot Points" are not the same as actual pivot points - Potential pivot points will paint on the chart at bar close, giving you an immediate alert to potential tops/bottoms of market trends. You can choose to display only the strongest potential points, or include some of the weaker signals too.
"Actual Pivot Points" are inherintly more accurate than Potential pivot points, but do not paint on the chart until after a pre-determined amount of time has passed. These are great for placing stop losses/take profits or watching the market for breakouts or reversals.
"Support/Resistance Levels" plots up to 6 support and resistance horizontal lines based on recent price tops/bottoms. Use these to determine areas where price could rebound or break-through.
"Bollinger Band Breakout" - Bollinger bands are a tried and tested technical analysis tool, similar to pivot points and support/resistance lines, thee are another great tool to determine where price may retrace, consolidate or breakout.
- Ichimoku Cloud
Somewhat confusing and intimidating when you first come across this technical analysis indicator, the "Ichimoku Cloud" is one of our favorites. Assisting with the detection of Dynamic Support and Resistance levels, Momentum and Trend Direction all in one super indicator.
Although certain aspects of the Ichimoku Cloud are already present within Crypto Tipster v2 algorithms in order to offer you the best possible signals, we've also included a user-definable section of it's own so you can manually set up and use the cloud for your own trading needs, all cloud signals (and there are many) are available to set up as Alerts for your own needs or an Auto-Trading Bot.
- Custom Alerts for Any Signal
We've endeavoured to ensure that all signals, not just the Buy/Sell signals, are ready and available to create Alerts with; giving you the most opportunity to create a fully custom trading engine that suits your exact trading requirements.
This means you can set Alerts for any and all signals you can see on the chart when using Crypto Tipster v2, this includes Buy/Sell Signals, Trend Strength Signals, Choppy Market Signals, Stop Loss/Take Profit Signals, Pivot Points, S/R levels crossed above & below, Bollinger Band Breakout and several Ichimoku Cloud Signals.. the list goes on!
---------------------
We've tried to make Crypto Tipster as comprehensive and easy to understand as possible, we are however always in search of progression; we do really love to hear your feedback :)
For more information and a free 8-day trial please visit the link in our signature
Happy Trading Guys

iMoku (Ichimoku Complete Tool) - The Quant Science iMoku™ is a professional all-in-one solution for the famous Ichimoku Kinko Hyo indicator.
The algorithm includes:
1. Backtesting spot
2. Visual tool
3. Auto-trading functions
With iMoku you can test four different strategies.
Strategy 1: Cross Tenkan Sen - Kijun Sen
A long position is opened with 100% of the invested capital ($1000) when "Tenkan Sen" crossover "Kijun Sen".
Closing the long position on the opposite condition.
There are 3 different strength signals for this strategy: weak, normal, strong.
Weak : the signal is weak when the condition is true and the price is above the 'Kumo'
Normal : the signal is normal when the condition is true and the price is within the 'Kumo'
Strong : the signal is strong when the condition is true and the price is below the 'Kumo'
Strategy 2: Cross Price - Kijun Sen
A long position is opened with 100% of the invested capital ($1000) when the price crossover the 'Kijun Sen'.
Closing the long position on the opposite condition.
There are 3 different strength signals for this strategy: weak, normal, strong.
Weak : the signal is weak when the condition is true and the price is above the 'Kumo'
Normal : the signal is normal when the condition is true and the price is inside the 'Kumo'
Strong : the signal is strong when the condition is true and the price is below the 'Kumo'
Strategy 3: Kumo Breakout
A long position is opened with 100% of the invested capital ($1000) when the price breakup the 'Kumo'.
Closing the long position with a percentage stop loss and take profit on the invested capital.
Strategy 4: Kumo Twist
A long position is opened with 100% of the invested capital ($1000) when the 'Kumo' goes from negative to positive (called "Twist").
Closing the long position on the opposite condition.
There are 2 different strength signals for this strategy: weak, and strong.
Weak : the signal is weak when the condition is true and the price is above the 'Kumo'
Strong : the signal is strong when the condition is true and the price is below the 'Kumo'
This script is compliant with algorithmic trading.
You can use this script with trading terminals such as 3Commas or CryptoHopper. Connecting this script is very easy.
1. Enter the user interface
2. Select and activate a strategy
3. Copy your bot's links into the dedicated fields
4. Create and activate alert
Disclaimer: algorithmic trading involves risk, the user should consider aspects such as slippage, liquidity and costs when evaluating an asset. The Quant Science is not responsible for any kind of damage resulting from use of this script. By using this script you take all the responsibilities and risks.

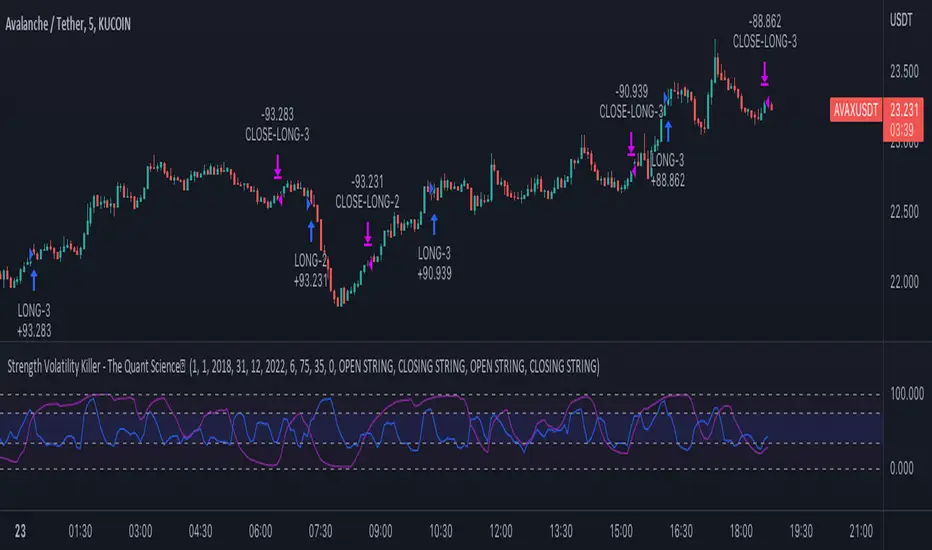
Strength Volatility Killer - The Quant ScienceStrength Volatility Killer - The Quant Science™ is based on a special version of RSI (Relative Strength Index), created with the simple average and standard deviation.
DESCRIPTION
The algorithm analyses the market and opens positions following three different volatility entry conditions. Each entry has a specific and personal exit condition. The user can setting trailing stop loss from user interface.
USER INTERFACE SETTING
Configures the algorithm from the user interface.
AUTO TRADING COMPLIANT
With the user interface, the trader can easily set up this algorithm for automatic trading.
BACKTESTING INCLUDED
The trader can adjust the backtesting period of the strategy before putting it live. Analyze large periods such as years or months or focus on short-term periods.
NO LIMIT TIMEFRAME
This algorithm can be used on all timeframes.
GENERAL FEATURES
Multi-strategy: the algorithm can apply long strategy or short strategy.
Built-in alerts: the algorithm contains alerts that can be customized from the user interface.
Integrated indicator: indicator is included.
Backtesting included: quickly automatic backtesting of the strategy.
Auto-trading compliant: functions for auto trading are included.
ABOUT BACKTESTING
Backtesting refers to the period 13 June 2022 - today, ticker: AVAX/USDT, timeframe 5 minutes.
Initial capital: $1000.00
Commission per trade: 0.03%
GRID SPOT TRADING ALGORITHM - GRID BOT TRADING STRATEGYGRID SPOT TRADING ALGORITHM : LONG ONLY STRATEGY OPEN SOURCE
This is a long only strategy for spot assets.
HOW IT WORKS
Grid trading is a trading strategy where an investor creates a so-called "price grid". The basic idea of the strategy is to repeatedly buy at the pre-specified price and then wait for the price to rise above that level and then sell the position (and vice versa with shorting or hedging).
FEATURES
Grids: This algorithm has a total of 10 grids.
Take profit: The trader can increase or decrease the distance between the grids from the User Interface panel, the distance between one grid and another represents the take profit.
Management: The algorithm buys 10% of the capital every time the price breaks down a grid and sells during a rise to the next higher grid. The initial capital is invested in 10 sizes which represent 10% of the capital per trade.
Stop Loss: The algorithm knows no stop loss as long as it is not activated from the User Interface panel. By activating the stop loss from the User Interface panel the algorithm will insert a close condition on all trades which will be calculated from the last lower grid.
Trades: Trades are opened only if the price is within the grid. If the market leaves the grid the algorithm will not buy new positions or sell new positions.
Optimal market conditions: The favorable market for this algorithm is the sideways market.
LIMITATIONS OF THE MODEL
The trader must take into account that this is a static model. It only works perfectly well if the market is in a sideways phase and incurs heavy losses if the market takes a downward trend. The model is unusable for an uptrend. The trader must therefore carefully analyze the market where he intends to use this strategy, making sure that the price is in a sideways phase.
USES
Indispensable research and backtesting tool for those using bots for their investments. The algorithm produces a backtesting of the strategy for past history. It is used by professional traders to understand if this strategy has been profitable on a market and what parameters to use for bots using this strategy (Kucoin, Binance etc.).
If you would like to develop your own algorithm with customized conditions based on a grid strategy, please contact us.
If you need help in using this tool, please contact us without hesitation.

DMI + HMA - No Risk ManagementDMI (Directional Movement Index) and HMA (Hull Moving Average)
The DMI and HMA make a great combination, The DMI will gauge the market direction, while the HMA will add confirmation to the trend strength.
What is the DMI?
The DMI is an indicator that was developed by J. Welles Wilder in 1978. The Indicator was designed to identify in which direction the price is moving. This is done by comparing previous highs and lows and drawing 2 lines.
1. A Positive movement line
2. A Negative movement line
A third line can be added, which would be known as the ADX line or Average Directional Index. This can also be used to gauge the strength in which direction the market is moving.
When the Positive movement line (DI+) is above the Negative movement line (DI-) there is more upward pressure. Ofcourse visa versa, when the DI- is above the DI+ that would indicate more downwards pressure.
Want to know more about HMA? Check out one of our other published scripts
What is this strategy doing?
We are first waiting for the DMI to cross in our favoured direction, after that, we wait for the HMA to signal the entry. Without both conditions being true, no trade will be made.
Long Entries
1. DI+ crosses above DI-
2. HMA line 1 is above HMA line 2
Short Entries
1. DI- Crosses above DI+
2. HMA line 1 is below HMA lilne 2
Its as simple as that.
Conclusion
While this strategy does have its downsides, that can be reduced by adding some risk manegment into the script. In general the trade profitability is above average, And the max drawdown is at a minimum.
The settings have been optimised to suite BTCUSDT PERP markets. Though with small adjustments it can be used on many assets!

OnePunch Algo Momentum Indicator V1This is another Plugin from One Punch Algo Team. We call it OnePunch Algo Momentum Indicator V1.
Basic Use:
One Punch Algo Momentum Indicator plugin is used for momentum stocks and high volatility crypto. It provide signals based on Simple Moving Average, Volume, Support & Resistance Lines.
SIGNALS/ALERTS
Buy Signal: Purple Color uptrend icon gives you a signal of an up-trending movement or we call it momentum movement. This signal basically happen when a stock land in a high volatility zone. We use in-build systems such as SMA, Support and Resistance and Trends to come up with the Buy Signal.
Sell Signal: Gray Color downtrend icon gives you a signal of a downtrend movement.
Other Lines Shown in the Diagram:
Red Line is the 200 Day Simple Moving Average (SMA)
Green Line is the 50 Day Simple Moving Average (SMA)
Strategy Tester
Always make sure to use the strategy tester to test how historically our Algo has performed in different time frames. One Punch Algo Momentum Indicator provide the ability to backtest based on certain time periods. This allows you to backtest our Algo vs some other Algo to find which performed well for the given time period, you if you want to see buy and hold performance better than the use of an Algo. This is a strong tool to use for your analysis of a stock or crypto.
What are the timeframes where it is most effective?
Different Stocks or Crypto perform differently with One Punch Algo Momentum Indicator. Please make sure to backtest a stock or crypto before you use the strategy.
Short Term/Day Trading Setup
For Short Term or Day Trade: 1min, 5min, 15min & 30min candlesticks works really well.
Also 3min, 5min, 7min and 15min works as well
Mid Term Trading Setup
For Mid-term traders: 30min, 1hr,2hr, and 4hr setup works really well.
For Long Term Trading Setup
For long term traders: 4hr, 1D, 1Week and 1Month Setup works well.
Best used with Heikin Ashi or Candlestick charts.
DISCLAIMER: Stocks and options trading involves substantial RISK of LOSS and is NOT suitable for every investor. The valuation of stocks and options may fluctuate, and, as a result, clients may lose more than their original investment. If the market moves against you, you may sustain a total loss greater than the amount you deposited into your account. You are responsible for all the risks and financial resources you use and for the chosen trading system. You should not engage in trading unless you fully understand the nature of the transactions you are entering into and the extent of your exposure to loss. If you do not fully understand these risks, you must seek independent advice from your financial advisor.
All trading strategies are used at your own risk. And OnePunch ALGO Developer, Youtuber or the channel does NOT take any responsibility for your losses using any of the advice or suggestions or strategies are shown/said in any of OnePunch ALGO Youtuber or the channel videos.
Hull Crossover Strategy no TP or SLWhat is it?
A simple yet effective strategy ran on the 30m chart.
This is a basic idea that can be expanded on using different indicator to either add signals or filter out certain bad signals!
The strategy consists of 1 fast moving average and 1 slow moving average.
Both of these moving averages are the Hull Moving Average
What is the Hull Moving Average?
The Hull Moving Average ( HMA ) is a directional trend indicator.
It captures the current market conditions and uses recent price action to determine if conditions are bullish or bearish relative to historical data.
The Hull is different from traditional trend indicators like the EMA and the SMA .
It is designed to reduce the lag often associated with other MAs by providing a faster signal on a smoother visual plane.
How it works?
When the fast HMA crosses over the slow HMA , we initiate a long signal, and
when the fast HMA crosses under the slow HMA , we initiate a short signal.
Conclusion
The power of simplicity is what makes this such a great core to use to build onto making something even better!
The results were optimised to suit the most common market conditions seen today.
******** Not financial advice! ********

Ichimoku Cloud Strategy Long Only [Bitduke]Slightly modificated and optimized for Pine Script 4.0, Ichimoku Cloud Strategy which, suddenly, good suitable for the several crypto assets.
Details:
Enter position when conversion line crosses base line up, and close it when the opposite happens.
Additional condition for open / close the trade is lagging span, it should be higher than cloud to open position and below - to close it.
Backtesting:
Backtested on SOLUSDT ( FTX, Binance )
+150% for 2021 year, 8% dd
+191% for all time, 32% dd
Disadvantages:
- Small number of trades
- Need to vary parameters for different coins (not very robust)
Should be tested carefully for other coins / stock market. Different parameters could be needed or even algo modifications.
Strategy doesn't repaint.

hamster-bot PDD Pump and Dump DetectorPump and Dump detector by hamster-bot
strategy author: foresterufa
Pump and Dump detector (PDD)
This is a trend strategy, with a unique mechanism of multi-stage re-entry into a position (Take Profit-Entry) when a significant trend develops, based on our HiDeep indicator.
Positions are opened by the HiDeep indicator signal with trend direction filtering and volatility filtering. Positions are closed by a HiDeep indicator signal or a change in the trend direction.
The position can be accompanied by a unique Stoploss trailing MA.

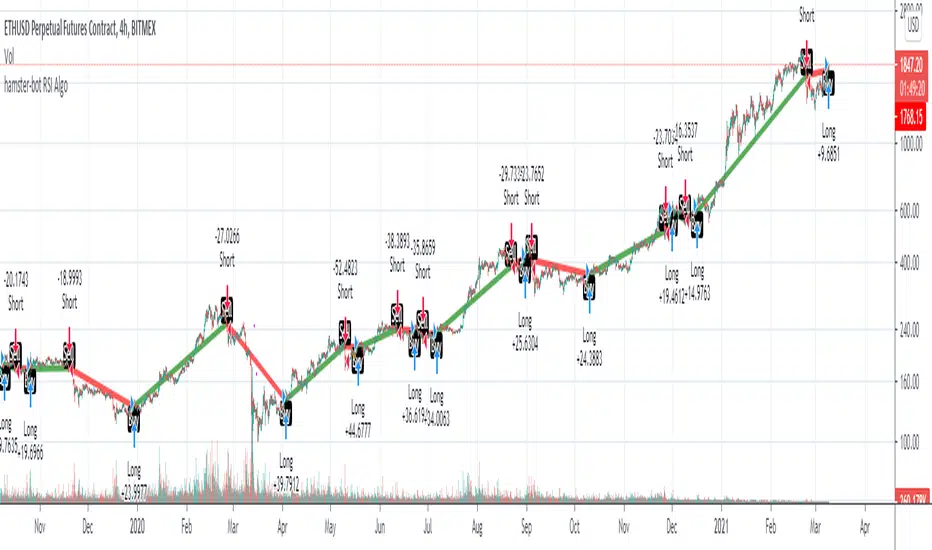
hamster-bot RSI AlgoThis is a simple RSI based signal indicator. It is designed for algorithmic bot trading.
For best results, leave a time-frame of at least 1 hour.
When the RSI reaches 70, it gives a buy signal, and when the RSI reaches 30, it gives a sell signal. The position is then maintained until the opposite signal is given. If backtesting shows poor results, but looks like the opposite would be good, there is a simple switch in the settings to turn it over.
original indicator on the basis of which the strategy is made:
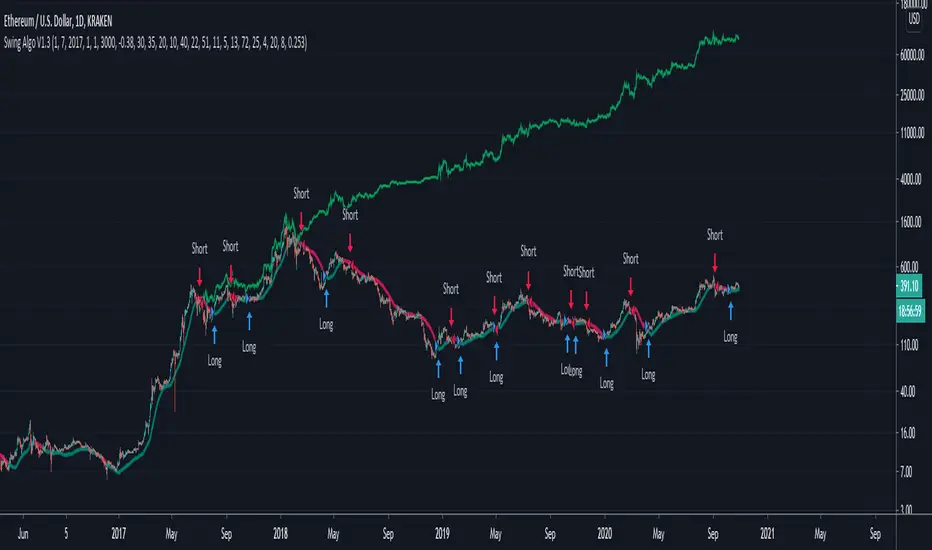
Swing Algo V1.3An upgrade of Swing Algo V1.2 to reduce chop heavily, used for trading ETH. For differences to other versions, see below.
This indicator can be used for e.g. swing algorithmic trading. It will give Buy/Long and Sell/Short signals on the chart. This algorithm uses a combination of several (custom) functions and rules to find good entry points for trend trading. After many iterations and tests I came up with this particular setup, which is highly optimized for the ETH/USD trading pair on the daily (D) timeframe. Attention was also paid to stability, as all parameters are set onto plateaus, so that smaller changes in the characteristic price action should not affect the efficiancy too much. For other assets and/or timeframes it is however possible to change algorithmic parameters within the indicator settings to tune this swing algorithm. You don't need any programming skills or similar abilities to navigate this indicator.
For the here presented backtest data, we omitted the biggest portion of the cryptocurrency bullrun in 2017 (starting only at 1st July 2017) so that the results become more realistic for long-term swing traders (investing at least 2-3 years into trading) if such large runs do not happen again. As cryptocurrencies like Ethereum are still to this date capable of doing comparatively smaller runs of about 2-3x in a few weeks/months (as witnessed in 2020), the order of magnitude of the shown results is still realistic for long-term trend trading efforts. Do not expect these results in a matter of days or weeks, and of course as with any trading strategy past performances are not indicative of future results.
Within this indicator you can choose the backtest time interval to test the perfomance of this algorithm for different time windows and different trading pairs. Here various backtesting parameters (e.g. trading fees) can be customized. Default settings for the shown backtest are a starting balance of $1000, a slippage of 2 ticks (= $0.02) and a trading fee of 0.26 % (which is the worst taker fee on the Kraken exchange) to have realistic settings. However as we do not conduct many trades with this strategy, fees should not impact our performance too much. As long-term swing traders, we devote one initial portion of our portfolio to swing trading and from then on always use 100% of this portion for the next trade to get the compounding starting. This is in difference to other trading styles which use various, often very small, percentage values for their short- or mid-term trades. Keep this in mind when evaluating the backtest data. Also note that due to the small number of trades the statistical significance is low. It is not possible to gather an abundance of long-term trend signals in the order of hundreds or thousands trades, as much more time would have to pass for this in the case of rather new assets like Ethereum.
Additionally to the TradingView Strategy Tester you can also plot your equity directly on the chart to get a sense for the performance. For this you can also scale the equity graph to e.g. match the starting point of your equity with some price point on the chart to get a direct comparison to 'Buy & Hold' strategies over time.
This indicator (and all other content I provide) is no financial advice. If you use this indicator you agree to my Terms and Conditions which can be found on my Twitter profile linked on my TradingView profile or in my signature.
Differences to other versions:
- Changed from a dual (V1, V1.1) to a single smoothing function system (V1.2, V1.3), which can react better to more sudden price movements that got prevalent during the current end-phase of the stock bullmarket due to correlations, while still handling 'normal' price action well
- Changed the oscillator part of the algorithm again with one that handles chop for the ETH/USD trading pair extremely well.
- Improved net profits by potentially +100% in comparison to V1 for ETH/USD on daily timeframe
- However for other assets (e.g. BTC and smaller coins like XTZ and ALGO) and timeframes V1 might perform better than V1.3 due to somewhat different characteristic price action. I leave you with all options to play so that you can find the best solution for a given trading pair.
- There's also a previous version called Swing Algo V1.2 considered the go-to algo at the moment, which works similar to V1.3, but operates a bit less tight, leading to more flexibility while suppressing chop not as much as V1.3.
For access please contact me via DM on TradingView or on Twitter (linked on my TradingView profile and my signature). People who purchased access to any 'Swing Algo 1.x' get access to all other 'Swing Algo V1.x' indicators automatically ('Swing Algo V1' counts as 'Swing Algo V1.0').
Swing Algo V1.2The next upgrade in the 'Swing Algo V1.x' series, and the go-to algorithm for trading ETH (until further notice). For differences to other versions, see below.
This indicator can be used for e.g. swing algorithmic trading. It will give Buy/Long and Sell/Short signals on the chart. This algorithm uses a combination of several (custom) functions and rules to find good entry points for trend trading. After many iterations and tests I came up with this particular setup, which is highly optimized for the ETH/USD trading pair on the daily (D) timeframe. Attention was also paid to stability, as all parameters are set onto plateaus, so that smaller changes in the characteristic price action should not affect the efficiancy too much. For other assets and/or timeframes it is however possible to change algorithmic parameters within the indicator settings to tune this swing algorithm. You don't need any programming skills or similar abilities to navigate this indicator.
For the here presented backtest data, we omitted the biggest portion of the cryptocurrency bullrun in 2017 (starting only at 1st July 2017) so that the results become more realistic for long-term swing traders (investing at least 2-3 years into trading) if such large runs do not happen again. As cryptocurrencies like Ethereum are still to this date capable of doing comparatively smaller runs of about 2-3x in a few weeks/months (as witnessed in 2020), the order of magnitude of the shown results is still realistic for long-term trend trading efforts. Do not expect these results in a matter of days or weeks, and of course as with any trading strategy past performances are not indicative of future results.
Within this indicator you can choose the backtest time interval to test the perfomance of this algorithm for different time windows and different trading pairs. Here various backtesting parameters (e.g. trading fees) can be customized. Default settings for the shown backtest are a starting balance of $1000, a slippage of 2 ticks (= $0.02) and a trading fee of 0.26 % (which is the worst taker fee on the Kraken exchange) to have realistic settings. However as we do not conduct many trades with this strategy, fees should not impact our performance too much. As long-term swing traders, we devote one initial portion of our portfolio to swing trading and from then on always use 100% of this portion for the next trade to get the compounding starting. This is in difference to other trading styles which use various, often very small, percentage values for their short- or mid-term trades. Keep this in mind when evaluating the backtest data. Also note that due to the small number of trades the statistical significance is low. It is not possible to gather an abundance of long-term trend signals in the order of hundreds or thousands trades, as much more time would have to pass for this in the case of rather new assets like Ethereum.
Additionally to the TradingView Strategy Tester you can also plot your equity directly on the chart to get a sense for the performance. For this you can also scale the equity graph to e.g. match the starting point of your equity with some price point on the chart to get a direct comparison to 'Buy & Hold' strategies over time.
This indicator (and all other content I provide) is no financial advice. If you use this indicator you agree to my Terms and Conditions which can be found on my Twitter profile linked on my TradingView profile or in my signature.
Differences to other versions:
- Changed from a dual (V1, V1.1) to a single smoothing function system (V1.2, V1.3), which can react better to more sudden price movements that got prevalent during the current end-phase of the stock bullmarket due to correlations, while still handling 'normal' price action well
- Changed the oscillator part of the algorithm with a better suited one (at least) for the ETH/USD trading pair, handling chop better.
- Improved net profits by potentially +100% in comparison to V1 for ETH/USD on daily timeframe
- However for other assets (e.g. BTC and smaller coins like XTZ and ALGO) and timeframes V1 might perform better than V1.2 due to somewhat different characteristic price action. I leave you with all options to play so that you can find the best solution for a given trading pair.
- There's also an upgrade called Swing Algo V1.3, which works similar to V1.2, but reduces losses due to chop even further. Because V1.2 is a bit more flexible, it is, however, considered the go-to algo for the time being.
For access please contact me via DM on TradingView or on Twitter (linked on my TradingView profile and my signature). People who purchased access to any 'Swing Algo 1.x' get access to all other 'Swing Algo V1.x' indicators automatically ('Swing Algo V1' counts as 'Swing Algo V1.0').

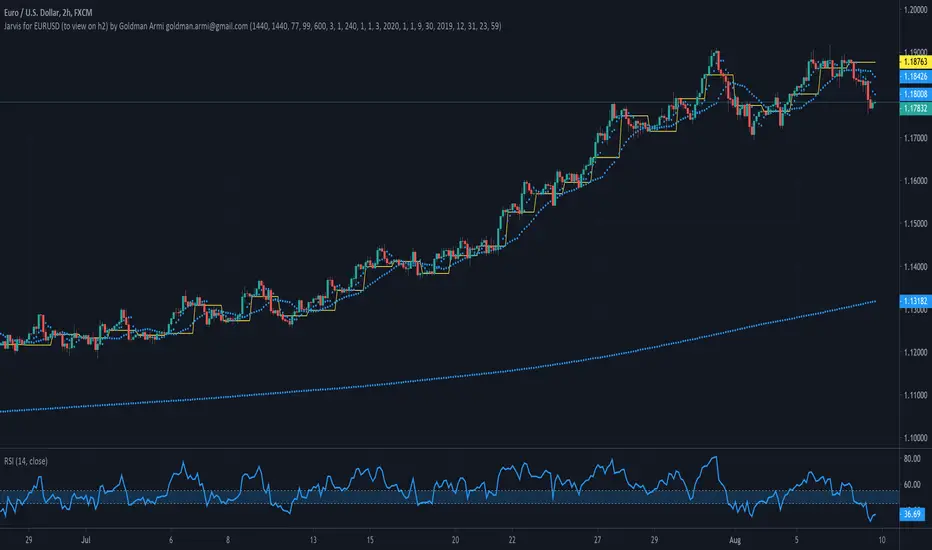
Jarvis for EURUSD by Goldman ArmiThis strategy is called JARVIS after the famous AI from the MARVEL movie Iron Man.
It is an improvement of the Copernicus Strategy to get better results. More exactly I was aiming to obtain over 50% of the number of trades profitable, for every pair provided (see the title).
The strategy tester does not include leverage trading, please keep that in mind and feel free to change the parameters of the volume for the position in the strategy settings to see the closer to reality results.
The setup for this strategy is more complicated because it includes 3 averages, all of them calculated with prices obtain by various formulas for each one of them and I call this: Sophisticated Moving Average (Copyright). Each of the 3 averages are applied to different timeframes and have different values. All of these parameters are configured separately for every trading pair and this is why I am publishing them separately.
There are not a lot of trades in this strategy, the average is around 3/month for EURUSD and the result you see in this strategy is from January 2020 to this date of publishing.
You can use the Tradingview alert services to configure this to execute (webhook) on your exchange/broker, because strategies have now the possibility to send alerts.
For other questions please send me a message.
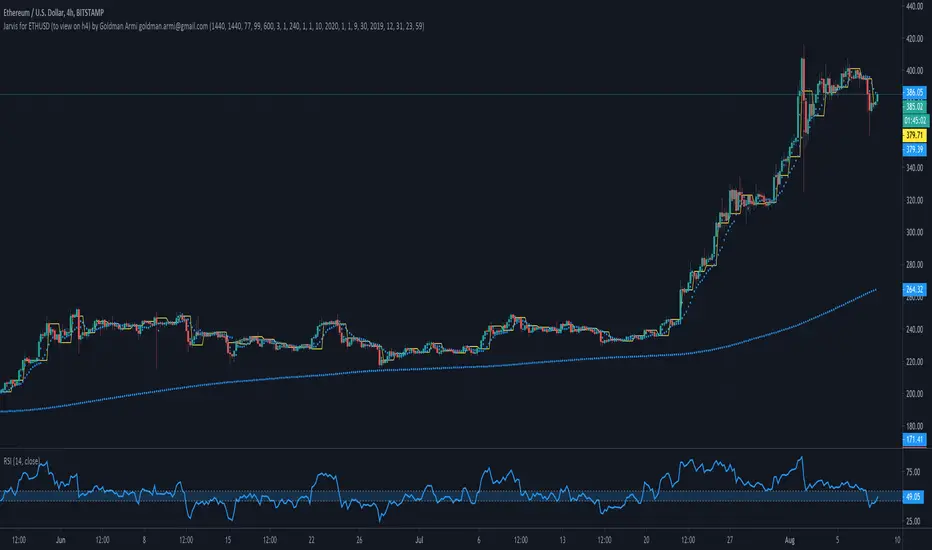
Jarvis for ETHUSD by Goldman ArmiThis strategy is called JARVIS after the famous AI from the MARVEL movie Iron Man.
It is an improvement of the Copernicus Strategy to get better results. More exactly I was aiming to obtain over 50% of the number of trades profitable, for every pair provided (see the title).
The strategy tester does not include leverage trading, please keep that in mind and feel free to change the parameters of the volume for the position in the strategy settings to see the closer to reality results.
The setup for this strategy is more complicated because it includes 3 averages, all of them calculated with prices obtain by various formulas for each one of them and I call this: Sophisticated Moving Average (Copyright). Each of the 3 averages are applied to different timeframes and have different values. All of these parameters are configured separately for every trading pair and this is why I am publishing them separately.
There are not a lot of trades in this strategy, the average is around 1/month.
You can use the Tradingview alert services to configure this to execute (webhook) on your exchange/broker, because strategies have now the possibility to send alerts.
For other questions please send me a message.
Jarvis for BTCUSD by Armi GoldmanThis strategy is called JARVIS after the famous AI from the MARVEL movie Iron Man.
It is an improvement of the Copernicus Strategy to get better results. More exactly I was aiming to obtain over 50% of the number of trades profitable, for every pair provided (see the title).
The strategy tester does not include leverage trading, please keep that in mind and feel free to change the parameters of the volume for the position in the strategy settings to see the closer to reality results.
The setup for this strategy is more complicated because it includes 3 averages, all of them calculated with prices obtain by various formulas for each one of them and I call this: Sophisticated Moving Average (Copyright). Each of the 3 averages are applied to different timeframes and have different values. All of these parameters are configured separately for every trading pair and this is why I am publishing them separately.
There are not a lot of trades in this strategy, the average is around 1/month.
You can use the Tradingview alert services to configure this to execute (webhook) on your exchange/broker, because strategies have now the possibility to send alerts.
For other questions please send me a message.

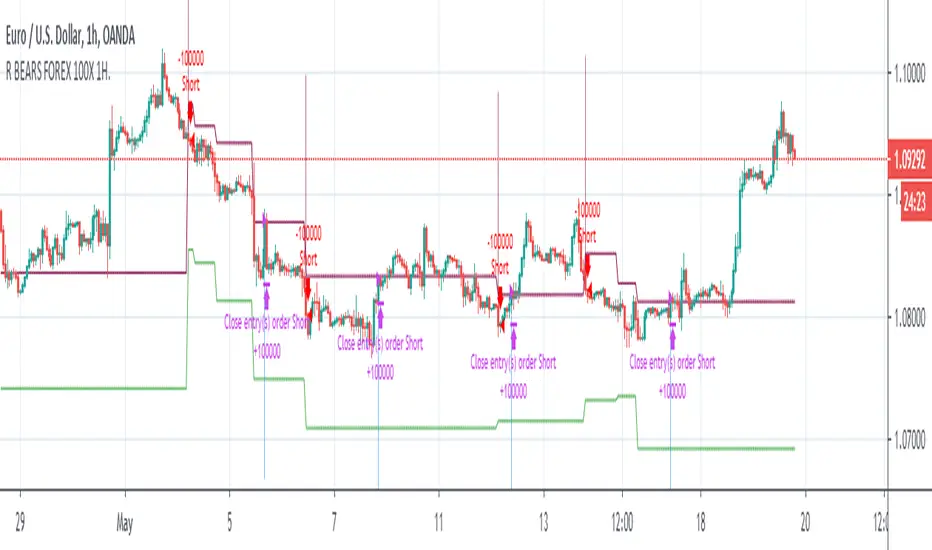
Relativity BEARS FOREX 50X 4H AlgorithmHello, this script is the correction of my old script related to Forex. (Bear market)
Old script :
4H was chosen as the time frame.
Thus, larger pips are at our disposal and we benefit more from the hedge effect of the leverage.
Commissions per trade have been removed to get more realistic commissions.
Because every wrong trade deletes all the 1% position size.
(with leverage effect)
Use the links below to obtain access to this indicator :

Relativity BULLS FOREX 50X 4H Algorithm
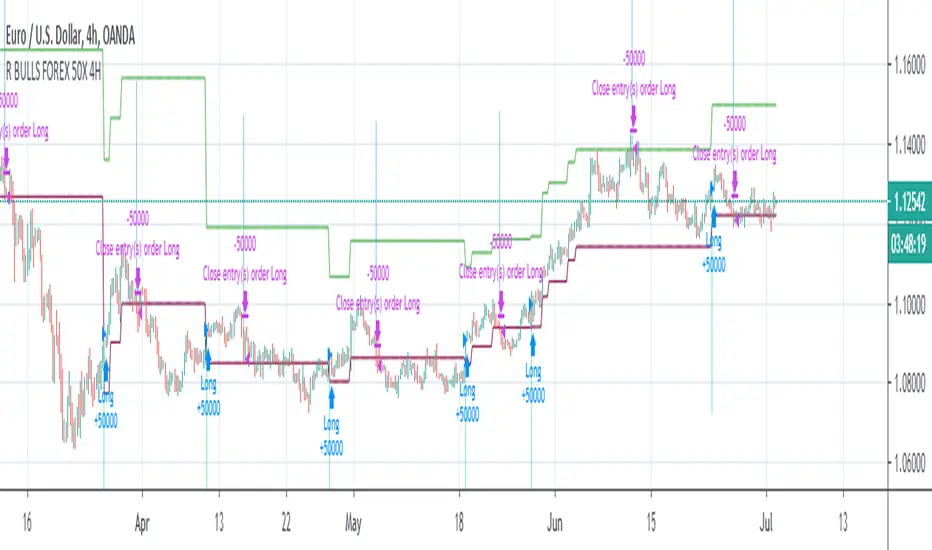
Hello, this script is the correction of my bull script related to Forex. (Bull market)
Old script :
4H was chosen as the time frame.
Thus, larger pips are at our disposal and we benefit more from the hedge effect of the leverage.
Commissions per trade have been removed to get more realistic commissions.
Because every wrong trade deletes all the 1% position size.
(with leverage effect)
Use the link below to obtain access to this indicator :
Relativity BEARS FOREX 100X 1H AlgorithmHi,
This system is prepared only for leveraged markets and only for Forex.
System parameters:
Timeframe = 1H (1 Hours)
Leverage = 100X
Position Size = %1 (0.01) Each Trade
System features :
- It targets the Risk /Reward Ratio of 1/3 and above. (Risk/Reward Ratio >= 3 )
- If a Take Profit Point has come in a successful trade but the parameter conformity has not deteriorated, system continues the trade.
- In this way, you can catch strong short trends several times a year.
But it is strict as stop-loss and avoids large declines,whipsaws whenever possible.
- The system tries to avoid unnecessary processes as much as possible.
This means less commission and less sideways market.
- Since it takes advantage of the reverse market, it is suitable not only for long and short but only for short position, ie "bears".
But this neutralizes unnecessary processes.
- Stop-Loss points and Take Profit (TP) points are shown in red and green.
-However, if there is a small amount of follow-up available at the computer, it is recommended to put stop-loss only.
Because the system revises both stop-loss and take profit points according to the conditions formed.
Doing this in the right major long trend here allows you to be in trades.
-The system takes into account the risk and only opens transactions where the value corresponding to 100 leverage ratio is greater than the risk.
This provides as much protection from risk as possible.
-Alerts added.
***Since it is located in the most risky market, the forex market, a balanced algorithm has been optimized, considering that it has a very unstable structure similar to dilithrium crystals (same logic as investment bank trader test).
So if this algorithm was a person, it would be an incredibly disciplined but equally skeptical person =)
Also, like other systems, this system also uses ANN (Artificial Neural Networks).
About Backtest :
Since this system is for leveraged market, backtest results are not healthy.
But since it targets the 1/3 Risk Reward Rate (3.00),
we must look Ratio Avg Win/Loss and it must be over 0.5 because :
This ratio means: When we reach 33% of our correct trades in all our trades, we are at breakeven.
This is 100 - 33 = 66
33/66 = 0.5
So whenever this rate is over 0.5, we make a profit.
*** The fact that this ratio must over 0.75 (worst scenario) in terms of securing ourselves because there will be extra comission fees for worst scenario.
Above this ratios ,we can do successful snowball trades.
And we achieve success cumulatively.
Important Note : This system is prepared only for these parameters.
NOTE :
The system has been prepared as a strategy to present success in a transparent manner.
Please check "Ratio Avg . Win / Avg Loss" rates in backtests.
Important Note 2 -
Although the system revises the stop and take profit points in the required parameters, the most accurate place is when the signal comes.
It should be entered when the signal comes as much as possible and if this did not happen,
trade must be opened in the nearest bars after the signal comes.
Best regards.
EDIT : Comission added. (%0.1)