♒RBCI - Range Bound Channel Index by Cryptorhythms♒ RBCI - Range Bound Channel Index by Cryptorhythms
Intro
This is my best approximation of the RBCI. Its not perfect, but it does the job well enough.
A good way to use it is to enter when the singal line (light blue) RE ENTERS the channel from below. I circled these points on the indicator in green.
Description
Information to create was gathered mostly here: www.finware.com
RBCI (Range Bound Channel Index) – is calculated by means of the channel (bandwidth) filter (CF). Channel filter simultaneously fulfills two functions:
Removes low frequent trend formed by low frequent components of the spectrum with periods, more T2= 1/fc2;
Removes high frequency noise formed by the high frequent components of the spectrum with periods, less T1= 1/fc1.
👍 Enjoying this indicator or find it useful? Please give me a like and follow! I post crypto analysis, price action strategies and free indicators regularly.
💬 Questions? Comments? Want to get access to an entire suite of proven trading indicators? Come visit us on telegram and chat, or just soak up some knowledge. We make timely posts about the market, news, and strategy everyday. Our community isn't open only to subscribers - everyone is welcome to join.
For Trialers & Chat: t.me
Adaptive

Dynamically Adjustable Moving AverageIntroduction
The Dynamically Adjustable Moving Average (AMA) is an adaptive moving average proposed by Jacinta Chan Phooi M’ng (1) originally provided to forecast Asian Tiger's futures markets. AMA adjust to market condition in order to avoid whipsaw trades as well as entering the trending market earlier. This moving average showed better results than classical methods (SMA20, EMA20, MAC, MACD, KAMA, OptSMA) using a classical crossover/under strategy in Asian Tiger's futures from 2014 to 2015.
Dynamically Adjustable Moving Average
AMA adjust to market condition using a non-exponential method, which in itself is not common, AMA is described as follow :
1/v * sum(close,v)
where v = σ/√σ
σ is the price standard deviation.
v is defined as the Efficacy Ratio (not be confounded with the Efficiency Ratio) . As you can see v determine the moving average period, you could resume the formula in pine with sma(close,v) but in pine its not possible to use the function sma with variables for length, however you can derive sma using cumulation.
sma ≈ d/length where d = c - c_length and c = cum(close)
So a moving average can be expressed as the difference of the cumulated price by the cumulated price length period back, this difference is then divided by length. The length period of the indicator should be short since rounded version of v tend to become less variables thus providing less adaptive results.
AMA in Forex Market
In 2014/2015 Major Forex currencies where more persistent than Asian Tiger's Futures (2) , also most traded currency pairs tend to have a strong long-term positive autocorrelation so AMA could have in theory provided good results if we only focus on the long term dependency. AMA has been tested with ASEAN-5 Currencies (3) and still showed good results, however forex is still a tricky market, also there is zero proof that switching to a long term moving average during ranging market avoid whipsaw trades (if you have a paper who prove it please pm me) .
Conclusion
An interesting indicator, however the idea behind it is far from being optimal, so far most adaptive methods tend to focus more in adapting themselves to market complexity than volatility. An interesting approach would have been to determine the validity of a signal by checking the efficacy ratio at time t . Backtesting could be a good way to see if the indicator is still performing well.
References
(1) J.C.P. M’ng, Dynamically adjustable moving average (AMA’) technical
analysis indicator to forecast Asian Tigers’ futures markets, Physica A (2018),
doi.org
(2) www.researchgate.net
(3) www.ncbi.nlm.nih.gov
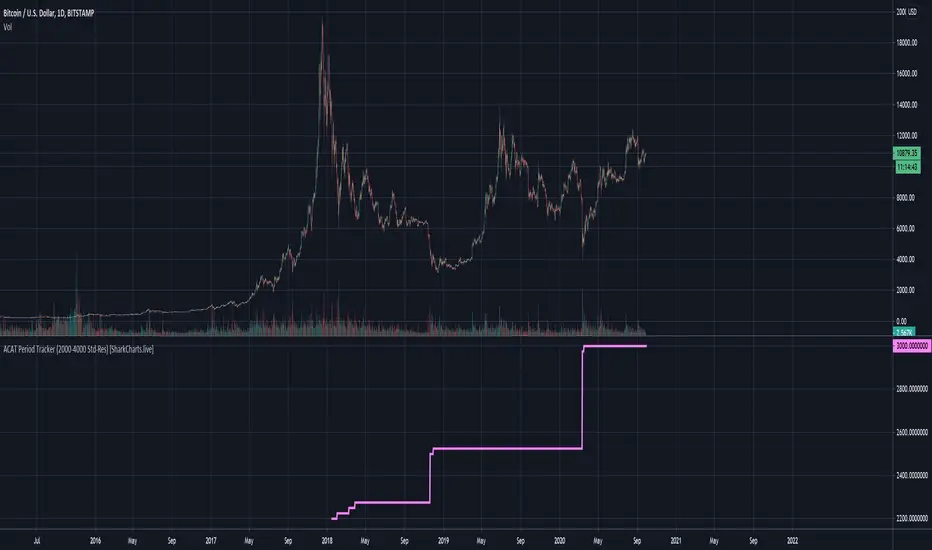
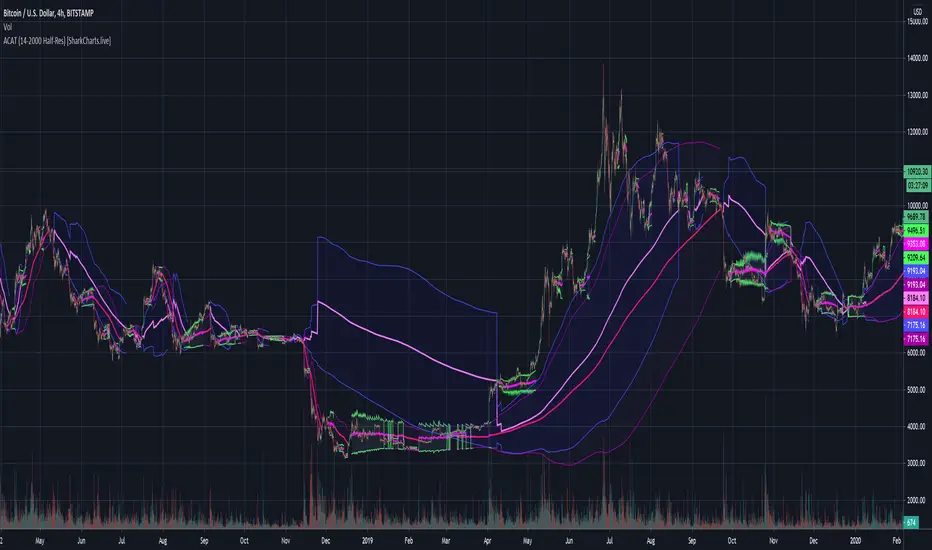
ACAT Period Tracker (2000-4000 Std-Res) [acatwithcharts]This is the corresponding period length tracker for ACAT (2000-4000 Std-Res). The constraints of Pinescript make it necessary to plot a separate indicator in a separate window to actually read out the period numbers without massively skewing the chart by default.
My volatility indicators are available by subscription in several packages through SharkCharts.live - and this is planned to be the first new one ready to add. I plan to release a video explaining how to use this indicator coinciding with launch, as there's a lot to talk about. Videos on my other indicators are currently hosted on DadShark's YouTube channel.
Current pricing and subscription details will be kept up-to-date on SharkCharts.live
ACAT (2000-4000 Std-Res) [acatwithcharts]Adaptive Comprehensive Average Tracker is a 2 in 1 version of Mean Reversion MA and Compression MA. The slightly odd name is a backronym that spells "ACAT" - suffice it to say, I'm pretty proud of what these two indicators have developed into.
The best solution I've managed to find to the variable count limits in Pinescript is to split the indicator into two that cover different ranges - and that aspect also theoretically allows for some other variations.
I've had difficulty increasing the resolution much without needing a huge number of individual indicators and running into constant Pinescript timeout issues. One thing that I can do, however, is extend the range further out.
Note that "Std-Res" here for this higher range was decided mostly based on, "What do I think I can get to work for higher than 2000 about as often as the existing 600-2000 indicator?" and is semi-arbitrary. At higher period lengths, the spread between different MAs decreases so less resolution is needed, while the calculation times increase dramatically, so this script is necessarily a lot less dense than the lower lengths. Sometimes this will load much faster as a result. I'm generally finding both struggle on shorter timeframes.
Keep in mind some caveats: resolution at these lengths is lower and finding relevant period lengths this far out necessarily means you should be trading them on higher timeframes. If you see something on the 3000 period on the 4h, you're talking about events happening near W benchmark length moving averages. If you see something in these periods lengths on the D timeframe as with some parabolic bubbles/crashes, you're looking at very macro pivots and targets happening near M benchmark length moving averages.
My volatility indicators are available by subscription in several packages through SharkCharts.live - and this is planned to be the first new one ready to add. I plan to release a video explaining how to use this indicator coinciding with launch, as there's a lot to talk about. Videos on my other indicators are currently hosted on DadShark's YouTube channel.
Current pricing and subscription details will be kept up-to-date on SharkCharts.live

ACAT (600-2000 Std-Res) [acatwithcharts](This is a reupload to help standardize the names in the invite-only indicators listing, which was otherwise doomed to be forever confusing.)
Adaptive Comprehensive Average Tracker is a 2 in 1 version of Mean Reversion MA and Compression MA. The slightly odd name is a backronym that spells "ACAT" - suffice it to say, I'm pretty proud of what these two indicators have developed into.
The best solution I've managed to find to the variable count limits in Pinescript is to split the indicator into two that cover different ranges. This version covers period lengths from 600-2000 at the same resolution seen in Mean Reversion MA and Compression MA. I've then added a toggle-able feature to hide the lower indicator's plot while it's maxed out which makes them look roughly stitched together and has a nice added benefit that it require less work by the higher period script so it loads more quickly.
The hope is to replace several indicators that have periodic issues timing out with fewer, which should be substantially more convenient to use and on average mean dealing with fewer refreshes.
My volatility indicators are available by subscription in several packages through SharkCharts.live - and this is planned to be the first new one ready to add. I plan to release a video explaining how to use this indicator coinciding with launch, as there's a lot to talk about. Videos on my other indicators are currently hosted on DadShark's YouTube channel.
Current pricing and subscription details will be kept up-to-date on SharkCharts.live

ACAT (14-600 Std-Res) [acatwithcharts]
(This is a reupload to help standardize the names in the invite-only indicators listing, which was otherwise doomed to be forever confusing.)
Adaptive Comprehensive Average Tracker is a 2 in 1 version of Mean Reversion MA and Compression MA. The slightly odd name is a backronym that spells "ACAT" - suffice it to say, I'm pretty proud of what these two indicators have developed into.
The best solution I've managed to find to the variable count limits in Pinescript is to split the indicator into two that cover different ranges. This version covers period lengths from 14-600 at the same resolution seen in the "600 Max" versions of Mean Reversion MA and Compression MA. I've then added a toggle-able feature to hide the lower indicator's plot while it's maxed out which makes them look roughly stitched together and has a nice added benefit that it require less work by the higher period script so it loads more quickly.
The hope is to replace several indicators that have periodic issues timing out with fewer, which should be substantially more convenient to use and on average mean dealing with fewer refreshes.
My volatility indicators are available by subscription in several packages through SharkCharts.live - and this is planned to be the first new one ready to add. I plan to release a video explaining how to use this indicator coinciding with launch, as there's a lot to talk about. Videos on my other indicators are currently hosted on DadShark's YouTube channel.
Current pricing and subscription details will be kept up-to-date on SharkCharts.live

ACAT Period Tracker (14-2000 Half-Res) [acatwithcharts]This is the corresponding period length tracker for ACAT (14-2000 Half-Res). The constraints of Pinescript make it necessary to plot a separate indicator in a separate window to actually read out the period numbers without massively skewing the chart by default.
Taking some lessons from how subscribers ended up making best use of the period length trackers for my prior scripts, I've set the default line widths wide so that it pairs well on the same window as 3D WAVE-PM. Notably, you would need to use both standard range coverage of 3D WAVE-PM and the Hi-Res 605-2000 period version to pair with this higher tracking range in that setup.
My volatility indicators are available by subscription in several packages through SharkCharts.live - and this is planned to be the first new one ready to add. I plan to release a video explaining how to use this indicator coinciding with launch, as there's a lot to talk about. Videos on my other indicators are currently hosted on DadShark's YouTube channel.
Current pricing and subscription details will be kept up-to-date on SharkCharts.live

ACAT Period Tracker (14-600 Std-Res) [acatwithcharts]This is the corresponding period length tracker for ACAT (14-600 Std-Res). The constraints of Pinescript make it necessary to plot a separate indicator in a separate window to actually read out the period numbers without massively skewing the chart by default.
Taking some lessons from how subscribers ended up making best use of the period length trackers for my prior scripts, I've set the default line widths wide so that it pairs well on the same window as 3D WAVE-PM.
My volatility indicators are available by subscription in several packages through SharkCharts.live - and this is planned to be the first new one ready to add. I plan to release a video explaining how to use this indicator coinciding with launch, as there's a lot to talk about. Videos on my other indicators are currently hosted on DadShark's YouTube channel.
Current pricing and subscription details will be kept up-to-date on SharkCharts.live

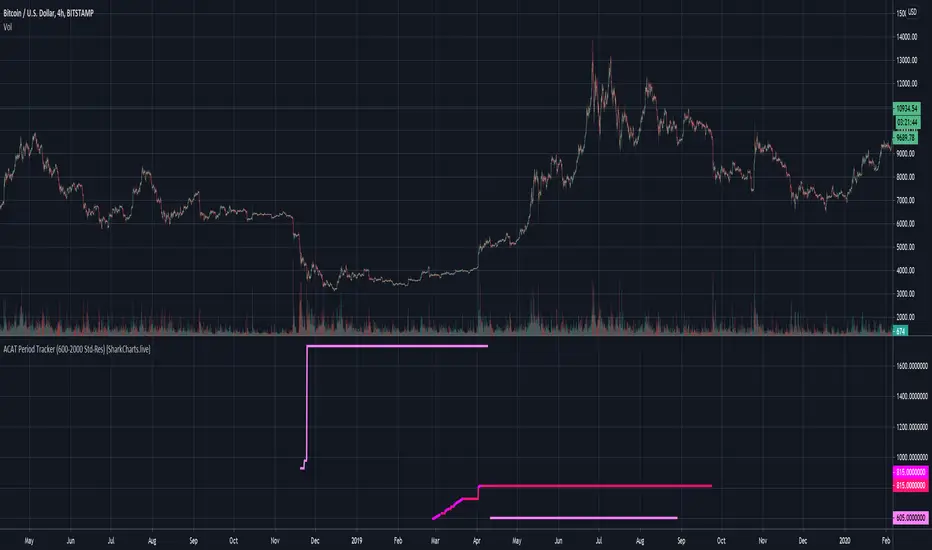
ACAT Period Tracker (600-2000 Std-Res) [acatwithcharts]This is the corresponding period length tracker for ACAT (600-2000 Std-Res). The constraints of Pinescript make it necessary to plot a separate indicator in a separate window to actually read out the period numbers without massively skewing the chart by default.
Taking some lessons from how subscribers ended up making best use of the period length trackers for my prior scripts, I've set the default line widths wide so that it pairs well on the same window as 3D WAVE-PM. Notably, you would need to use the Hi-Res 605-2000 period version to pair with this higher tracking range in that setup.
My volatility indicators are available by subscription in several packages through SharkCharts.live - and this is planned to be the first new one ready to add. I plan to release a video explaining how to use this indicator coinciding with launch, as there's a lot to talk about. Videos on my other indicators are currently hosted on DadShark's YouTube channel.
Current pricing and subscription details will be kept up-to-date on SharkCharts.live
ACAT (14-2000 Half-Res) [acatwithcharts]Adaptive Comprehensive Average Tracker is a 2 in 1 version of Mean Reversion MA and Compression MA. The slightly odd name is a backronym that spells "ACAT" - suffice it to say, I'm pretty proud of what these two indicators have developed into.
As I've looked into ways to lower variable count and optimize ACAT, I've found that decreasing the resolution in half to allow the full range that I otherwise split across two indicators is broadly more convenient to use and seems to have faster loading and far fewer timeouts. There is a significant precision tradeoff that is most acutely felt with more dramatic sawtoothing when plotting the current highest compressed period. For most practical use cases, I think people will want to make this trade-off and then if necessary to look at a compression range do a second pass with a higher resolution version of the indicator.
My volatility indicators are available by subscription in several packages through SharkCharts.live - and this is planned to be the first new one ready to add. I plan to release a video explaining how to use this indicator coinciding with launch, as there's a lot to talk about. Videos on my other indicators are currently hosted on DadShark's YouTube channel.
Current pricing and subscription details will be kept up-to-date on SharkCharts.live
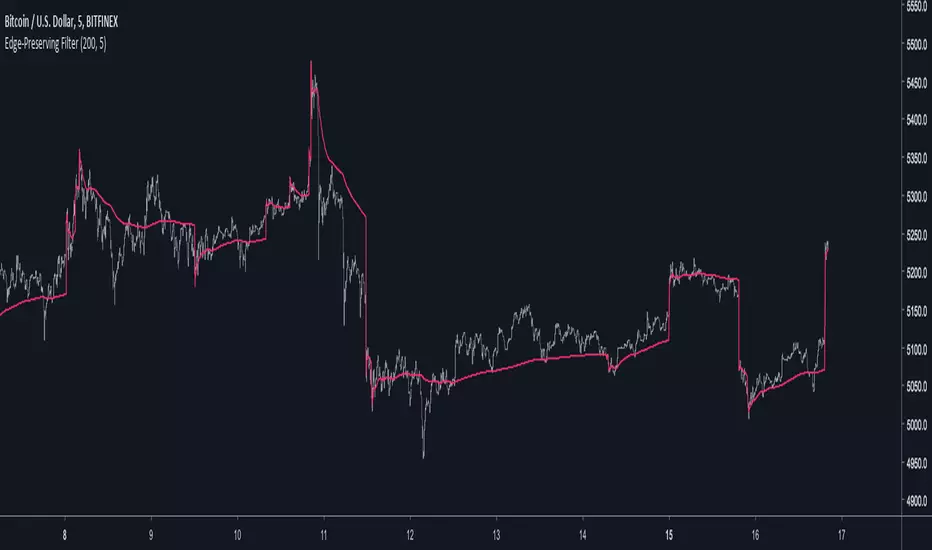
Edge-Preserving FilterIntroduction
Edge-preserving smoothing is often used in image processing in order to preserve edge information while filtering the remaining signal. I introduce two concepts in this indicator, edge preservation and an adaptive cumulative average allowing for fast edge-signal transition with period increase over time. This filter have nothing to do with classic filters for image processing, those filters use kernels convolution and are most of the time in a spatial domain.
Edge Detection Method
We want to minimize smoothing when an edge is detected, so our first goal is to detect an edge. An edge will be considered as being a peak or a valley, if you recall there is one of my indicator who aim to detect peaks and valley (reference at the bottom of the post) , since this estimation return binary outputs we will use it to tell our filter when to stop filtering.
Filtering Increase By Using Multi Steps Cumulative Average
The edge detection is a binary output, using a exponential smoothing could be possible and certainly more efficient but i wanted instead to try using a cumulative average approach because it smooth more and is a bit more original to use an adaptive architecture using something else than exponential averaging. A cumulative average is defined as the sum of the price and the previous value of the cumulative average and then this result is divided by n with n = number of data points. You could say that a cumulative average is a moving average with a linear increasing period.
So lets call CMA our cumulative average and n our divisor. When an edge is detected CMA = close price and n = 1 , else n is equal to previous n+1 and the CMA act as a normal cumulative average by summing its previous values with the price and dividing the sum by n until a new edge is detected, so there is a "no filtering state" and a "filtering state" with linear period increase transition, this is why its multi-steps.
The Filter
The filter have two parameters, a length parameter and a smooth parameter, length refer to the edge detection sensitivity, small values will detect short terms edges while higher values will detect more long terms edges. Smooth is directly related to the edge detection method, high values of smooth can avoid the detection of some edges.
smooth = 200
smooth = 50
smooth = 3
Conclusion
Preserving the price edges can be useful when it come to allow for reactivity during important price points, such filter can help with moving average crossover methods or can be used as a source for other indicators making those directly dependent of the edge detection.
Rsi with a period of 200 and our filter as source, will cross triggers line when an edge is detected
Feel free to share suggestions ! Thanks for reading !
References
Peak/Valley estimator used for the detection of edges in price.
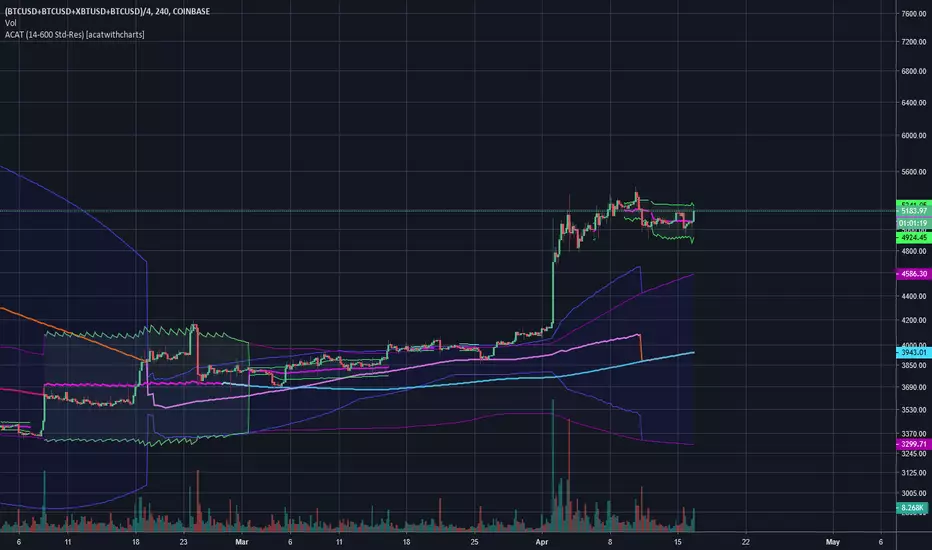
ACAT (600-2000) [acatwithcharts]Adaptive Comprehensive Average Tracker is a 2 in 1 version of Mean Reversion MA and Compression MA. The slightly odd name is a backronym that spells "ACAT" - suffice it to say, I'm pretty proud of what these two indicators have developed into.
The best solution I've managed to find to the variable count limits in Pinescript is to split the indicator into two that cover different ranges. This version covers period lengths from 600-2000. I've then added features to hide the lower indicator's plot while it's maxed out which makes them look roughly stitched together and has a nice added benefit that it require less work by the higher period script so it loads more quickly.
This is still a work in progress at the time of posting as I attempt to try to add more functionality and improve the intuitiveness of the combined menu, but assuming all goes well, I may be able to mostly deprecate the individual indicators and replace them with this combined version when I'm satisfied that it's ready to release to subscribers.
My volatility indicators are available by subscription in several packages through SharkCharts.live - and this is planned to be the first new one ready to add. I plan to release a video explaining how to use this indicator coinciding with launch, as there's a lot to talk about. Videos on my other indicators are currently hosted on DadShark's YouTube channel.
Current pricing and subscription details will be kept up-to-date on SharkCharts.live

Adaptive Comprehensive Average Tracker (ACAT) [acatwithcharts]Adaptive Comprehensive Average Tracker is a 2 in 1 version of Mean Reversion MA and Compression MA. The slightly odd name is a backronym that spells "ACAT" - suffice it to say, I'm pretty proud of what these two indicators have developed into.
At the moment, it is limited to the 600-period cap; just using the logic of the two indicators in one hits runs into the limits of Pinescript. I've got some ideas to try, but for most practical purposes, the 600 cap was generally enough and the longer lookbacks are very prone to timing out anyway.
The hope is to replace two indicators that have periodic issues timing out with one, which should be substantially more convenient to use and on average mean dealing with fewer refreshes.
This is still a work in progress at the time of posting as I attempt to try to add more functionality and improve the intuitiveness of the combined menu, but assuming all goes well, I may be able to mostly deprecate the individual indicators and replace them with this combined version when I'm satisfied that it's ready to release to subscribers.
My volatility indicators are available by subscription in several packages through SharkCharts.live - and this is planned to be the first new one ready to add. I plan to release a video explaining how to use this indicator coinciding with launch, as there's a lot to talk about. Videos on my other indicators are currently hosted on DadShark's YouTube channel.
Current pricing and subscription details will be kept up-to-date on SharkCharts.live
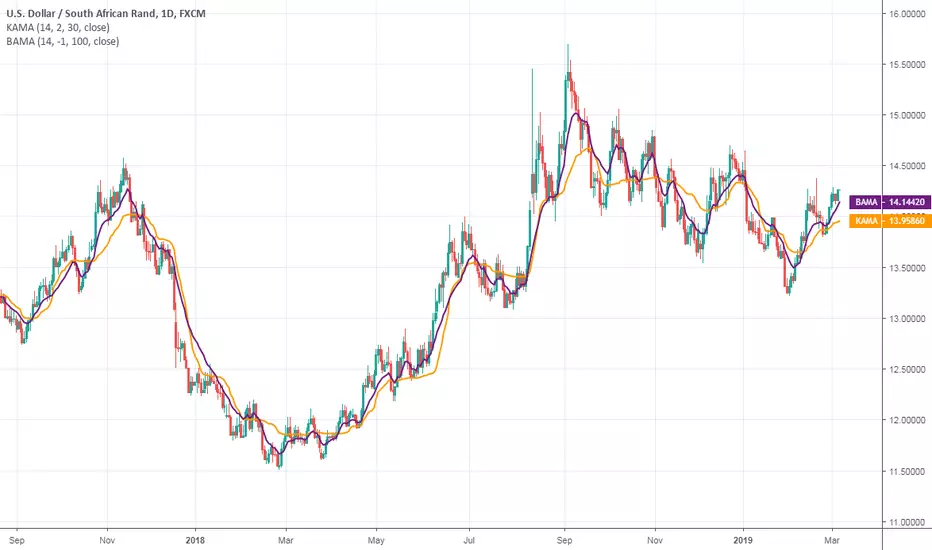
Bryant Adaptive Moving Average@ChartArt got my attention to this idea.
This type of moving average was originally developed by Michael R. Bryant (Adaptrade Software newsletter, April 2014). Mr. Bryant suggested a new approach, so called Variable Efficiency Ratio (VER), to obtain adaptive behaviour for the moving average. This approach is based on Perry Kaufman' idea with Efficiency Ratio (ER) which was used by Mr. Kaufman to create KAMA.
As result Mr. Bryant got a moving average with adaptive lookback period. This moving average has 3 parameters:
Initial lookback
Trend Parameter
Maximum lookback
The 2nd parameter, Trend Parameter can take any positive or negative value and determines whether the lookback length will increase or decrease with increasing ER.
Changing Trend Parameter we can obtain KAMA' behaviour
To learn more see www.adaptrade.com
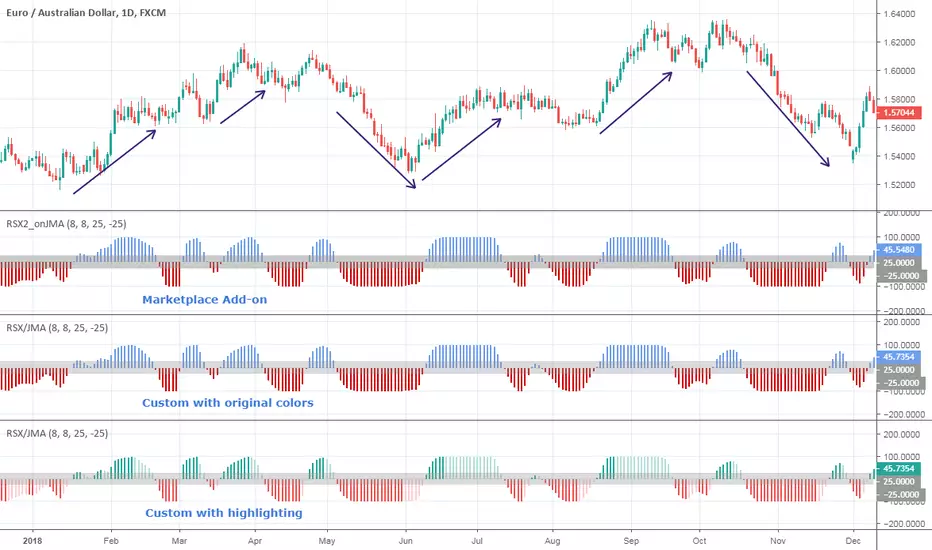
Jurik RSX on JMAHello friends,
Meet Jurik RSX on JMA — a refined version of Jurik's classic RSX that applies advanced pre-smoothing using the best
original JMA clone available on TradingView. By filtering the input price through JMA, it delivers a cleaner, faster, and more efficient representation of market momentum — maintaining exceptional smoothness with almost no lag.
🛠 How It Works
RSX is Jurik's noise-free alternative to the traditional RSI, designed to measure trend direction and efficiency with minimal distortion. However, when the input price is noisy, even RSX can lose precision.
To solve this, the input price is first smoothed with JMA — Jurik's most advanced low-lag filter. As Jurik Research noted:
“A smooth (low noise) trend is more efficient than a noisy trend... RSX would respond better when fed pre-smoothed price data. And there's no better way to pre-smooth than by using JMA.”
This approach allows RSX to reverse with the market almost instantly , reacting sharply to genuine turning points while ignoring random fluctuations — providing traders with a clear, stable view of trend dynamics.
🔥 Key Features
JMA pre-smoothing integrated with Jurik RSX
Near-zero lag response with reduced noise
Optional overbought/oversold breakout highlighting
If you have any questions or would like to explore related Jurik-based tools, feel free to contact me directly via DM.
👋 Good luck and happy trading!
유료 스크립트
Jurik JMA/DWMA MACDHello friends,
Meet the Jurik JMA/DWMA MACD — an oscillator version of the crossover system originally recommended by Mark Jurik. It combines the Jurik Moving Average (JMA) and the Double Weighted Moving Average (DWMA) to form a smooth yet highly responsive convergence/divergence signal.
🛠 How It Works
Unlike standard EMA-based MACDs, this version uses Jurik's advanced non-lagging smoothing method to eliminate noise without sacrificing responsiveness , resulting in exceptionally clear and timely momentum readings.
I use the best original JMA clone available on TradingView — its behavior closely matches the genuine Jurik algorithm.
As Mark Jurik stated:
“Of all the different combinations of moving average filters to use for a MACD oscillator, we prefer using the JMA–DWMA combination.”
This oscillator measures the distance between JMA and DWMA, revealing when short-term momentum diverges from the longer-term trend. The result is a non-lagging MACD-style signal that highlights shifts in trend strength, early reversals, and exhaustion zones — all with Jurik-level smoothness and precision.
🔥 Key Features
Non-lagging, noise-reduced oscillator response
Peak highlighting
Built-in alerts for bullish and bearish peaks
If you'd like access or have any questions, feel free to reach out to me directly via DM.
👋 Good luck and happy trading!
유료 스크립트

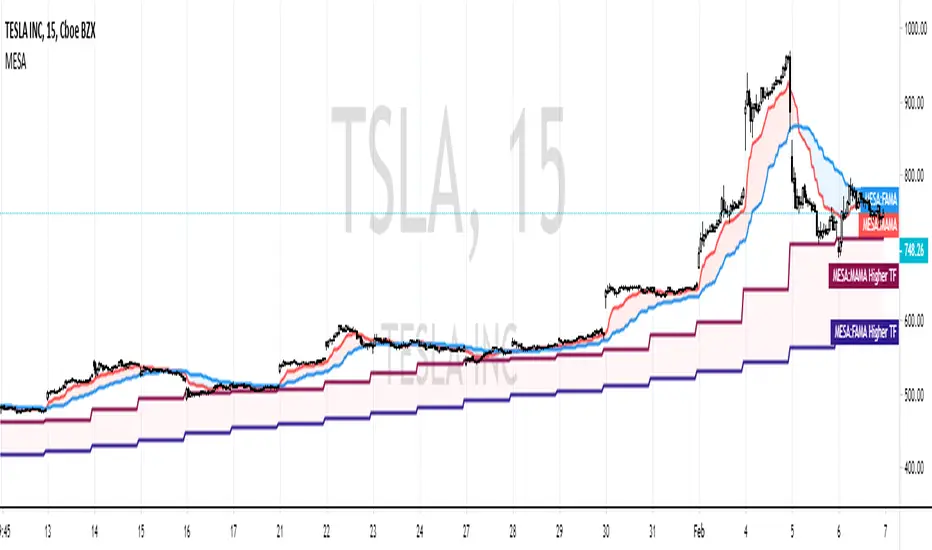
MESA Adaptive Moving AverageIntro
One of Ehlers most well-known indicators! I've seen many variations of this on TradingView, however, none seem to be true to the original released by Ehlers himself.
I've taken it upon myself to simply translate the MAMA into Pinescript, instead of re-writing like some others have done.
You can use it as a very effective & adaptive moving average with other signals or
as a standalone signal.
In the case that you're going to use it for signals and not simple technical trading (non-quantitative),
I've also added a threshold parameter to filter out weak signals.
My MAMA indicator is different from others in very simple ways - I don't use the nz() command, which sets all "Not a Number" values to 0. In others' scripts, you immediately load the indicator with several 0 values,
causing a slight lag in future calculations since this code is recursive (refers to previous values it generated).
In my version, I simply wait until the script has access to all the bar data it needs, instead of instantly performing calculations and
setting erroneous values to 0. In this case, we start with the correct values (or closer to correct).
If you want to compare this indicator the current most popular MAMA by LazyBear, you'll notice it often gives buy and sell crosses one bar earlier than theirs.
Setting Parameters
Source - the data series to perform calculations on. (Initially, Ehlers himself favored hl/2, but conceded that there isn't empirical benefit over close.)
Fast Limit - controls how quickly the MAMA will "ratchet up" fast price action. (Higher values are faster)
Slow Limit - controls how closely the FAMA will follow the MAMA. (Again, higher is faster. You typically want the FAMA to be slower though.)
Crossover Threshold - simple error thresholding to limit the number of weak trade signals. (Lower means lower tolerance)
Show Crosses? - show/hide the arrows at moving average crosses
Robust Cycle Measurement [Ehlers]The last of Ehlers Instantaneous Frequency Measurement methods.
This is a more robust version of this script.
I wrote it as a function, so you can simply copy and paste it into any script to add an adaptive period setting capability.
Cheers,
DasanC
Low Lag Exponential Moving AverageThis is a low-lag EMA, colorized to help identify turn around points. You have the option of making it adaptive as well, different methods
of signal processing or simply an average of the two.
See my previous script to understand how these adaptive methods work

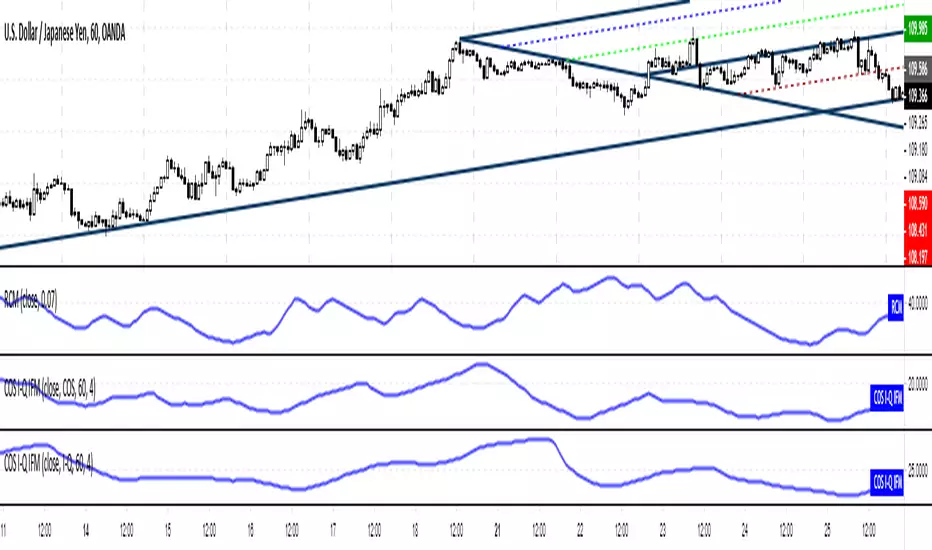
Adaptive Bandpass Filter [Ehlers]This is my latest bandpass filter - used to determine if a security is in a trend or cycle.
Now with an adaptive period setting! I use Ehlers in-phase & quadrature dominant cycle measurement (IQ IFM) method to set the period dynamically.
This method favors longer periods which tend to produce smoother, albeit laggier bandpass oscillator plots. From my quick tests, I tend to have lag between 4 and 8 bars, depending on the Timeframe.
The lower timeframes tend to have more noise and thus produce more interfering frequencies that may cause lag.
>Settings
Source: Select the data source to perform calc's on (close, open, etc...)
Period: Select the period to tune. Periods outside of this value will be attenuated (reduced)
Adaptive: Enable to have the I-Q IFM set the period for you (disables Period setting)
Bandpass Tolerance: Allow periods that are plus/minus the chosen period to pass.
Cycle Tolerance: Sensitivity of cycle mode. Lower values consider trends more frequent, higher values consider cycles more frequent.
Bandpass tolerance example: for instance, if this setting is 0.1 (10%) and Period is set to 20, then waves with a period of 18 - 22 will pass.
>How to read
Red line is the bandpass output, showing a lagged version of the dominant cycle representing the
Black lines are the upper and lower bounds for a cycle
Green Background indicates an uptrend
Red background indicates a downtrend

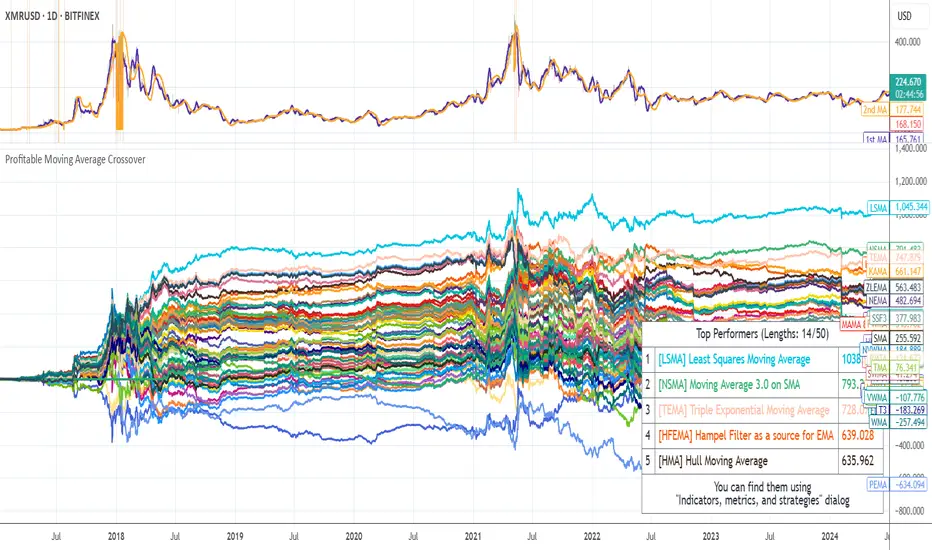
Profitable Moving Average CrossoverHello friends,
I'm glad to introduce a powerful research and optimization tool that takes the classic moving average crossover concept to a new level. Instead of relying on guesswork or fixed MA types, it lets you objectively discover the most profitable moving average pair for any instrument and timeframe.
🛠 How It Works
Moving average crossovers are among the most popular trading systems. A buy signal occurs when a shorter (faster) moving average crosses above a longer (slower) one, and a sell signal when it crosses below. The system's responsiveness — and the number of generated signals — depend on the chosen MA lengths and types.
This script evaluates 61 moving average types (including Jurik, Kaufman, Ehlers, Apirine, and others) and backtests all possible crossover combinations either across the entire chart history or within a custom backtest window . It then plots continuous profit metric lines for each crossover type and displays the top 5 performers in a results table. Each MA type is color-coded, allowing quick visual identification of which systems have historically delivered the strongest results.
🔥 Key Features
Pine Script V6 — optimized for performance and stability
Tests 61 moving average types , from classic to adaptive designs
Custom Backtest Window — analyze the entire history or a specific date range
Continuous profit curves for every crossover type plotted on chart
Top 5 crossover systems displayed in a compact summary table
Color-coded MA identifiers for fast visual comparison
Supports custom parameters for advanced MAs (JMA, ALMA, McGinley Dynamic, Adaptive Laguerre Filter, etc.)
Works seamlessly across all assets and timeframes
NOTE: Results will vary across different tickers and timeframes. Seeing strong performance in one preview does not imply similar profitability elsewhere — this variability is normal due to differing market structures.
NOTE 2: You can experiment with the tool independently or request a full study, in which case I'll share a spreadsheet of all backtest results with you.
👋 Good luck and happy trading!
유료 스크립트
Jurik Moving AverageThis is my best attempt to reproduce the original Jurik Moving Average. It differs from Jurik's a little bit, but in most cases it behaves like the original.
Jurik Moving Average is known as a superior noise elimination (causal, nonlinear and adaptive) filter and a world class moving average that tracks and smoothes price charts or any market-related time series with surprising agility.
Settings
Length (default: 7 )
Phase (default: 50 )
Price Source (default: close )
I attached some screenshots to show you how it works with other instruments
USDJPY, D
USDJPY, 60
USDCAD, D
USDCHF, D
EURUSD, D
GBPJPY, D
AUDUSD, D
XAUUSD, D
XAUUSD, 60
AAPL, D
AAPL, 60
MSFT, D
AMZN, D
BTCUSD, D
BTCUSD, 60
ETHUSD, D
Good luck and happy trading!