어큐물레이션 / 디스트리뷰션 라인 (ADL)
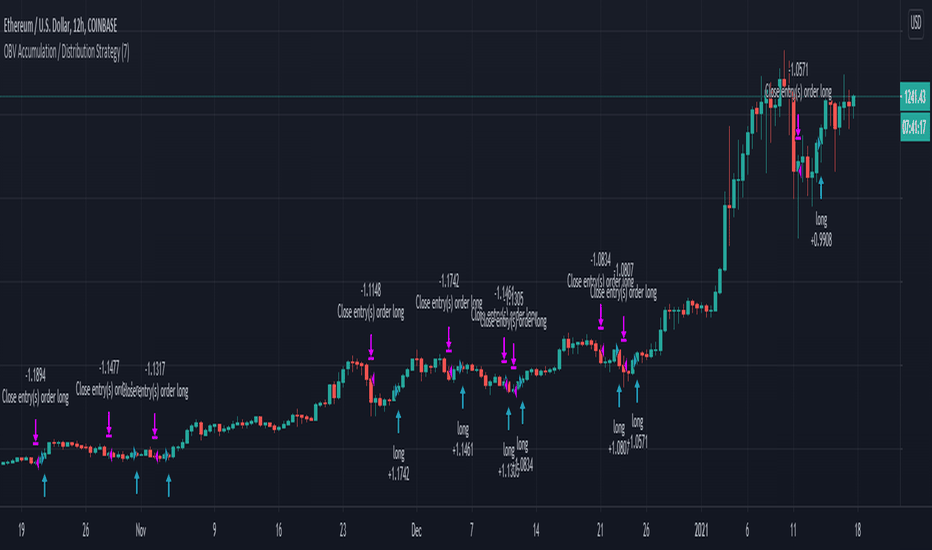
This version its made for 8-12h and works amazingly on the ETH pairs. Can be adapted to others as well For this example, I used an initial 1$ account, using always full capital on each trade(without using any leverage), together with a 0.1% commission/fees for each deal, on Coinbase broker. This is a long only strategy The components for the inside of the...
Divergence Template! This public indicator helps you to find as many divergences with as many indicators you like, without the long hassle of knowing and coding the divergence yourself. Just replace the "Divergence Condition" with your formula and give it a title in the second step, everything simply illustrated to someone without any coding experience!...
Simple Accumulation & Distribution indicator with the 21 and 200EMA plotted on it. Might be a useful tool in your arsenal.
Indicator to show a big change (Whale) in the same candle The candles change color, until the Momentum returns to zero After the movement of a whale, the market is usually on range, and there may be false entries The default values (2.618% and 20 lenght), are optimized for BTCUSD 15m --- Spanish Este indicador muestrar un gran cambio porcentual (ballena) en...
Hi, this script is the version of Accumulation / Distribution Money Flow (ADMF) that uses Open Interes ts in the required markets instead of Volume. Can be set from the menu. (Futures/Others) NOTE: I only modified this script. The original script belongs to cl8DH. Original of the script: I think it will make a difference in the future and commodity markets. ...
This script is an advanced version of the distributional blocks script. In distributional buys and sells: I used a high - low cloud filter, which makes it more prudent to sell the next sell higher for sells and to buy the next purchase lower for buys. I also used the Stochastic Money Flow Index function because it also uses volume to separate regions. The long...
This panel is an example position size panel that I prepared and I consider the rates reasonable. I have prepared this panel so that the money allocated to the investment ends 14 consecutive signals. The sum of the ratios is 100 units. You can adjust your positions according to this panel. The first steps are low rates. If the phrases are strong, you can...
This idea has been created by the combination of the two existing systems as a result of my efforts to create a distributional buying and selling guide that has plagued my head for a long time. 1st idea is Accumulation / Distribution Line : 2nd idea is Distribution Day : These two ideas, the intellectual assistance of professional brokers, and my observations...
2 weis wave volume length combined based on lazybear wwv
Volume Ticks is a zero-lag market sentiment indicator. It works by providing a cumulative count of increasing volume columns. A one count is added for each increasing volume column where close>open, and one is subtracted on an increasing volume column if close<open. That’s it. The count does not change when volume hasn’t increased compared to the previous bar’s...
This script is a simple extension of the script "Distribution Day" from user "kalle2017". Thanks to him! As the name suggests, the idea is to recognize "distribution days", when the "firm hands sell to the shaky hands" (Kostolany). So, too many distribution days in a certain timeframe can be a sign for a coming correction / bear market. A distribution day gets...
This indicator was originally developed by Marc Chaikin.
This is a EMA Delta Oscillator: An attempt to show ranging markets based on the slope of the EMA. Green = Bullish Market Blue = Ranging Market Red = Bearish Market The EMA Slope is normalized to make it work like an oscillator with values between 0 and 1. Bar colors show the oscillator colors, bar borders show the actual candle colors. - Invsto (sarangab)
An update to: Made it into and indicator. v. 0.0.1 DESIGNED FOR DAILY CHARTS
This is the simplified and optimized version of my original ADV indicator. It shows both regular volume bars and the accumulated/distributed (A/D) portion of them. The equation is elegant and intuitive. It calculates candle body to candle height ratio and multiplies it by volume: volume*(close-open)/(high-low). This is the building block of my three other...
This indicator shows Accumulation/Distribution level which can be used for confirming trends or reversals (via divergence). It is an alternative to Chaikin's Accumulation/Distribution Line (ADL) and On Balance Volume (OBV) indicators. It can also replicate PVT and OBV via options in the input menu. Here is a comparison of four related indicators: OBV is too...


![Whale Hunter [Gu5] BTCUSD: Whale Hunter [Gu5]](https://s3.tradingview.com/u/U7Jc3oMH_mid.png)


![2 Weis Wave Volume [xdecow] BTCUSD: 2 Weis Wave Volume [xdecow]](https://s3.tradingview.com/c/cQsNBRBw_mid.png)


![Volume Ticks - Increasing Volume Bar Count [LucF] BTCUSD: Volume Ticks - Increasing Volume Bar Count [LucF]](https://s3.tradingview.com/1/1ul3GgrZ_mid.png)


![XBT Volatility Weighted Bottom Finder. [For Daily Charts] BTCUSD: XBT Volatility Weighted Bottom Finder. [For Daily Charts]](https://s3.tradingview.com/h/HdSFR0RT_mid.png)
![Accumulation/Distribution Volume (ADV) [cI8DH] BTCUSD: Accumulation/Distribution Volume (ADV) [cI8DH]](https://s3.tradingview.com/x/XvC9iM7p_mid.png)

![Accumulation/Distribution Level (ADL) [Cyrus c|:D] BTCUSD: Accumulation/Distribution Level (ADL) [Cyrus c|:D]](https://s3.tradingview.com/w/Wj4NvOBH_mid.png)