PROTECTED SOURCE SCRIPT
업데이트됨 Pullback Indicator
Pullback Indicator
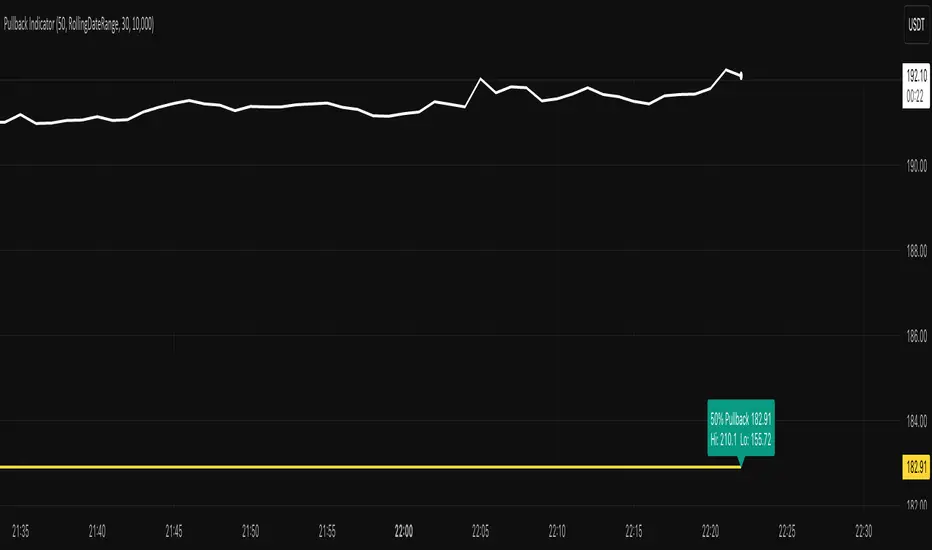
Plots a retracement level between a detected swing High and Low at a user-defined % (e.g., 38.2, 50, 61.8).
Formula: Level = Low + (High − Low) × (Pullback % / 100).
Merging Y-Axis into one
Once you add this indicator to the chart, you will see two Y-axes (or two price scales). Right-click on the price scales on the right, select “Merge all scales into one,” and choose “On the right.”
Modes
• Rolling → High/Low from last N bars on the chart’s timeframe. Recomputed every bar. Good for intraday, fast-adapting ranges.
• RollingDateRange → High/Low from a calendar window (Daily context). Options:
• RollDays = last N calendar days
• or Use Fixed Start Date (window expands day by day)
• Exclude Forming Day = ignore today’s incomplete daily candle for stable intraday levels.
Levels update once per daily bar unless today is included.
Inputs
• Pullback %
• Range Mode (Rolling | RollingDateRange)
• Lookback (bars)
• RollDays / Fixed Start Date
• Exclude Forming Day
• Show Pullback Label
Why range choice matters
Peak & trough are subjective—different windows give different High/Low. Select your window based on trading horizon:
• Intraday → Rolling (bars)
• Swing/position → RollingDateRange (days/fixed date)
How often are High/Low recomputed?
• Rolling (bars):
Recomputed on every bar of the chart’s timeframe using the most recent lookbackBars window. Levels can change frequently.
• RollingDateRange (Daily context):
Computed once per daily bar for the configured calendar window.
• With Exclude Forming Day = ON, the High/Low only update after the prior daily bar closes.
• With it OFF, the current (forming) daily bar can update the High/Low intraday if it sets a new extreme.
⸻
릴리즈 노트
Pullback IndicatorPlots a retracement level between a detected swing High and Low at a user-defined % (e.g., 38.2, 50, 61.8).
Formula: Level = Low + (High − Low) × (Pullback % / 100).
Merging Y-Axis into one
Once you add this indicator to the chart, you will see two Y-axes (or two price scales). Right-click on the price scales on the right, select “Merge all scales into one,” and choose “On the right.”
Modes
• Rolling → High/Low from last N bars on the chart’s timeframe. Recomputed every bar. Good for intraday, fast-adapting ranges.
• RollingDateRange → High/Low from a calendar window (Daily context). Options:
• RollDays = last N calendar days
• or Use Fixed Start Date (window expands day by day)
• Exclude Forming Day = ignore today’s incomplete daily candle for stable intraday levels.
Levels update once per daily bar unless today is included.
Inputs
• Pullback %
• Range Mode (Rolling | RollingDateRange)
• Lookback (bars)
• RollDays / Fixed Start Date
• Exclude Forming Day
• Show Pullback Label
Why range choice matters
Peak & trough are subjective—different windows give different High/Low. Select your window based on trading horizon:
• Intraday → Rolling (bars)
• Swing/position → RollingDateRange (days/fixed date)
How often are High/Low recomputed?
• Rolling (bars):
Recomputed on every bar of the chart’s timeframe using the most recent lookbackBars window. Levels can change frequently.
• RollingDateRange (Daily context):
Computed once per daily bar for the configured calendar window.
• With Exclude Forming Day = ON, the High/Low only update after the prior daily bar closes.
• With it OFF, the current (forming) daily bar can update the High/Low intraday if it sets a new extreme.
릴리즈 노트
Pullback IndicatorPlots a retracement level between a detected swing High and Low at a user-defined % (e.g., 38.2, 50, 61.8).
Formula: Level = Low + (High − Low) × (Pullback % / 100).
Merging Y-Axis into one
Once you add this indicator to the chart, you will see two Y-axes (or two price scales). Right-click on the price scales on the right, select “Merge all scales into one,” and choose “On the right.” Also, please right-click again, select Labels -> make sure "Indicators and financials value label" is checked
Modes
• Rolling → High/Low from last N bars on the chart’s timeframe. Recomputed every bar. Good for intraday, fast-adapting ranges.
• RollingDateRange → High/Low from a calendar window (Daily context). Options:
• RollDays = last N calendar days
• or Use Fixed Start Date (window expands day by day)
• Exclude Forming Day = ignore today’s incomplete daily candle for stable intraday levels.
Levels update once per daily bar unless today is included.
Inputs
• Pullback %
• Range Mode (Rolling | RollingDateRange)
• Lookback (bars)
• RollDays / Fixed Start Date
• Exclude Forming Day
• Show Pullback Label
Why range choice matters
Peak & trough are subjective—different windows give different High/Low. Select your window based on trading horizon:
• Intraday → Rolling (bars)
• Swing/position → RollingDateRange (days/fixed date)
How often are High/Low recomputed?
• Rolling (bars):
Recomputed on every bar of the chart’s timeframe using the most recent lookbackBars window. Levels can change frequently.
• RollingDateRange (Daily context):
Computed once per daily bar for the configured calendar window.
• With Exclude Forming Day = ON, the High/Low only update after the prior daily bar closes.
• With it OFF, the current (forming) daily bar can update the High/Low intraday if it sets a new extreme.
보호된 스크립트입니다
이 스크립트는 비공개 소스로 게시됩니다. 하지만 이를 자유롭게 제한 없이 사용할 수 있습니다 – 자세한 내용은 여기에서 확인하세요.
면책사항
해당 정보와 게시물은 금융, 투자, 트레이딩 또는 기타 유형의 조언이나 권장 사항으로 간주되지 않으며, 트레이딩뷰에서 제공하거나 보증하는 것이 아닙니다. 자세한 내용은 이용 약관을 참조하세요.
보호된 스크립트입니다
이 스크립트는 비공개 소스로 게시됩니다. 하지만 이를 자유롭게 제한 없이 사용할 수 있습니다 – 자세한 내용은 여기에서 확인하세요.
면책사항
해당 정보와 게시물은 금융, 투자, 트레이딩 또는 기타 유형의 조언이나 권장 사항으로 간주되지 않으며, 트레이딩뷰에서 제공하거나 보증하는 것이 아닙니다. 자세한 내용은 이용 약관을 참조하세요.