OPEN-SOURCE SCRIPT
업데이트됨 Consecutive Higher/Lower Closings
The Consecutive Higher/Lower Closings indicator is a powerful tool designed to assist traders in identifying potential buy and sell signals based on consecutive higher or lower closing prices. This indicator provides users with the flexibility to specify the number of consecutive higher or lower closings required to trigger a signal, allowing for a customizable trading strategy.
Key Features:
Usage:
How to Use:
Important Note:
Disclaimer:
Trading involves risk, and past performance does not guarantee future results. Always conduct thorough research and consider your risk tolerance before making trading decisions.
Key Features:
- Customizable Parameters: Users can define the number of consecutive higher and lower closings needed to generate buy and sell signals, providing a tailored approach to trading.
- Clear Buy and Sell Signals: The indicator plots clear buy and sell signals directly on the chart, making it easy for traders to identify potential entry and exit points.
Usage:
- Consecutive Higher Closings (Buy Signal): When the current closing price is higher than the previous closing price for the specified number of consecutive periods (as defined by the user), a buy signal will be generated.
- Consecutive Lower Closings (Sell Signal): When the current closing price is lower than the previous closing price for the specified number of consecutive periods (as defined by the user), a sell signal will be generated.
How to Use:
- Apply the Consecutive Higher/Lower Closings indicator to your chart.
- Adjust the input parameters, consecutiveHigherClosings and consecutiveLowerClosings, to match your preferred trading strategy. These parameters determine the number of consecutive higher and lower closings needed to trigger signals.
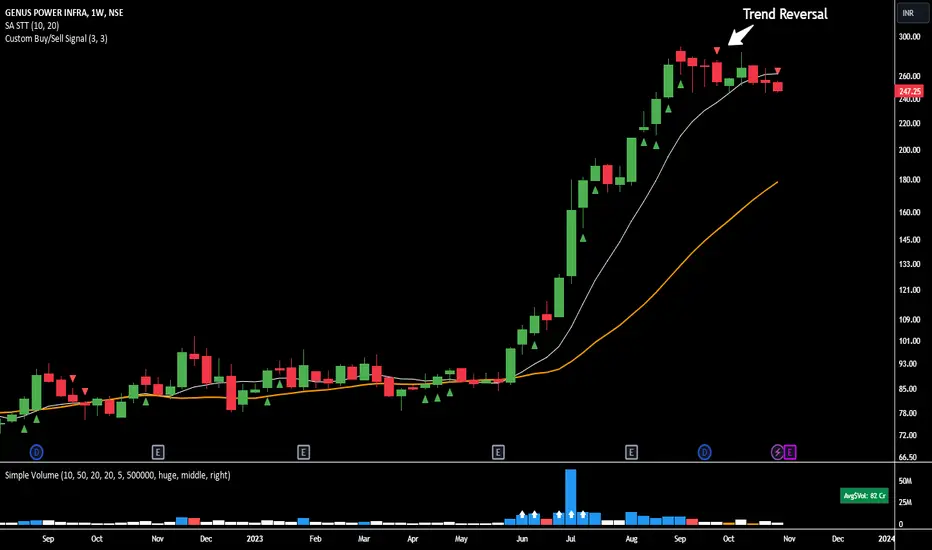
- Interpret the buy and sell signals generated by the indicator. When a buy signal is displayed (green triangle up), it suggests a potential entry point. Conversely, a sell signal (red triangle down) indicates a potential exit point.
Important Note:
- This indicator is designed to assist traders in making informed decisions, but it should be used in conjunction with other technical analysis tools and risk management strategies for a comprehensive trading approach.
- Kindly be aware that this strategy is most effective with Monster stocks with smooth price action, particularly when analyzing in weekly and/or daily timeframe.
Disclaimer:
Trading involves risk, and past performance does not guarantee future results. Always conduct thorough research and consider your risk tolerance before making trading decisions.
릴리즈 노트
Updates:- Consecutive Higher/Lower Values: Users can now specify the number of consecutive higher or lower values to trigger buy or sell signals.
- Value Type Selection: Choose the price type for analysis - Open, High, Low, or Close - using user-friendly checkboxes.
- Include Open in Analysis
- Include High in Analysis
- Include Low in Analysis
- Include Close in Analysis
This update offers greater customization, empowering traders to tailor the indicator to their preferred price metrics. Explore various combinations of consecutive values to fine-tune your trading signals.
오픈 소스 스크립트
트레이딩뷰의 진정한 정신에 따라, 이 스크립트의 작성자는 이를 오픈소스로 공개하여 트레이더들이 기능을 검토하고 검증할 수 있도록 했습니다. 작성자에게 찬사를 보냅니다! 이 코드는 무료로 사용할 수 있지만, 코드를 재게시하는 경우 하우스 룰이 적용된다는 점을 기억하세요.
면책사항
해당 정보와 게시물은 금융, 투자, 트레이딩 또는 기타 유형의 조언이나 권장 사항으로 간주되지 않으며, 트레이딩뷰에서 제공하거나 보증하는 것이 아닙니다. 자세한 내용은 이용 약관을 참조하세요.
오픈 소스 스크립트
트레이딩뷰의 진정한 정신에 따라, 이 스크립트의 작성자는 이를 오픈소스로 공개하여 트레이더들이 기능을 검토하고 검증할 수 있도록 했습니다. 작성자에게 찬사를 보냅니다! 이 코드는 무료로 사용할 수 있지만, 코드를 재게시하는 경우 하우스 룰이 적용된다는 점을 기억하세요.
면책사항
해당 정보와 게시물은 금융, 투자, 트레이딩 또는 기타 유형의 조언이나 권장 사항으로 간주되지 않으며, 트레이딩뷰에서 제공하거나 보증하는 것이 아닙니다. 자세한 내용은 이용 약관을 참조하세요.