OPEN-SOURCE SCRIPT
Frank-Setup EMA, RS & RSI ✅
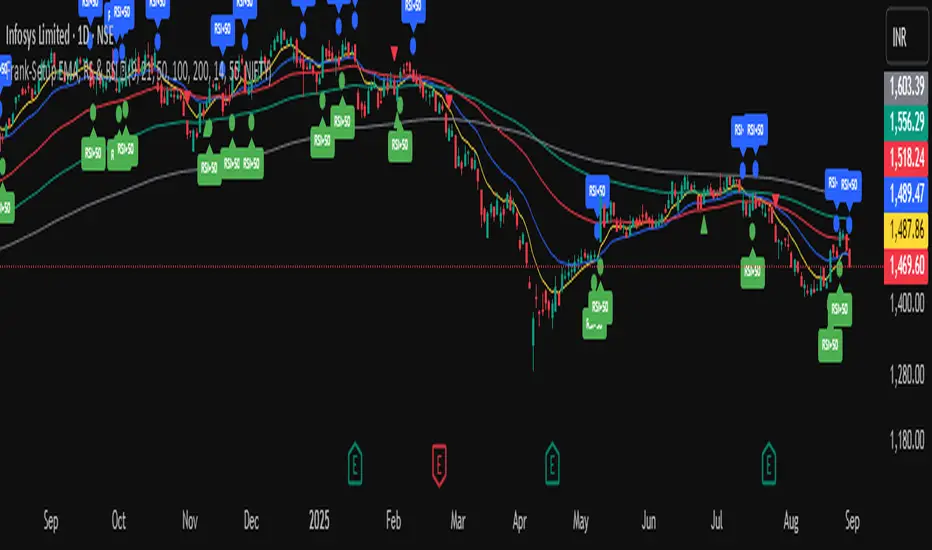
It is a clean and simple indicator designed to identify weakness in stocks using two proven methods: RSI and Relative Strength (RS) vs. a benchmark (e.g., NIFTY).
🔹 Features
RSI Weakness Signals
Plots when RSI crosses below 50 (weakness begins).
Plots when RSI moves back above 50 (weakness ends).
Relative Strength (RS) vs Benchmark
Compares stock performance to a chosen benchmark.
Signals when RS drops below 1 (stock underperforming).
Signals when RS recovers above 1 (strength resumes).
Clear Visual Markers
Circles for RSI signals.
Triangles for RS signals.
Optional RSI labels for clarity.
Built-in Alerts
Get notified instantly when RSI or RS weakness starts or ends.
No need to constantly watch charts.
🎯 Use Case
This tool is built for traders who want to:
Spot shorting opportunities when a stock shows weakness.
Track underperformance vs. the index.
Manage risk by exiting longs when weakness appears.
오픈 소스 스크립트
트레이딩뷰의 진정한 정신에 따라, 이 스크립트의 작성자는 이를 오픈소스로 공개하여 트레이더들이 기능을 검토하고 검증할 수 있도록 했습니다. 작성자에게 찬사를 보냅니다! 이 코드는 무료로 사용할 수 있지만, 코드를 재게시하는 경우 하우스 룰이 적용된다는 점을 기억하세요.
면책사항
해당 정보와 게시물은 금융, 투자, 트레이딩 또는 기타 유형의 조언이나 권장 사항으로 간주되지 않으며, 트레이딩뷰에서 제공하거나 보증하는 것이 아닙니다. 자세한 내용은 이용 약관을 참조하세요.
오픈 소스 스크립트
트레이딩뷰의 진정한 정신에 따라, 이 스크립트의 작성자는 이를 오픈소스로 공개하여 트레이더들이 기능을 검토하고 검증할 수 있도록 했습니다. 작성자에게 찬사를 보냅니다! 이 코드는 무료로 사용할 수 있지만, 코드를 재게시하는 경우 하우스 룰이 적용된다는 점을 기억하세요.
면책사항
해당 정보와 게시물은 금융, 투자, 트레이딩 또는 기타 유형의 조언이나 권장 사항으로 간주되지 않으며, 트레이딩뷰에서 제공하거나 보증하는 것이 아닙니다. 자세한 내용은 이용 약관을 참조하세요.