OPEN-SOURCE SCRIPT
업데이트됨 Fibonacci Forecast Indicator
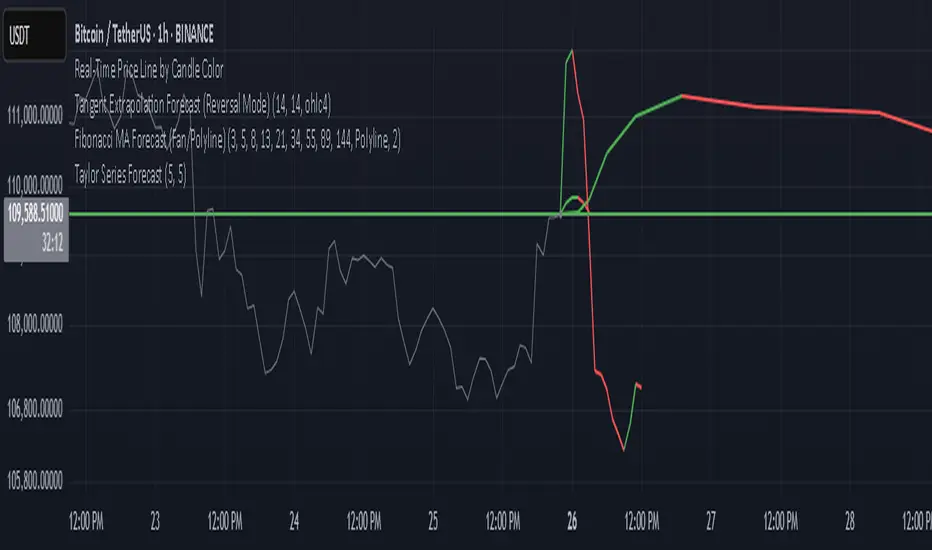
This indicator projects potential price movements into the future based on user-defined Fibonacci-period moving averages. By default, it calculates Simple Moving Averages (SMAs) for the 3, 5, 8, 13, and 21 bars (though you can customize these values). For each SMA, it measures the distance between the current closing price and that SMA, then extends the price forward by the same distance.
Key Features
1. Fibonacci MAs:
- Uses Fibonacci numbers (3, 5, 8, 13, 21) for SMA calculations by default.
- Fully customizable periods to fit different trading styles.
2. Forecast Projection:
- If the current price is above a given SMA, the forecast line extends higher (bullish bias).
- If the current price is below the SMA, the forecast line extends lower (bearish bias).
- Forecast lines are anchored at the current bar and project forward according to the same Fibonacci intervals.
3. Clean Visualization:
- Draws a series of connected line segments from the current bar’s close to each forecast point.
- This approach offers a clear, at-a-glance visual of potential future price paths.
How to Use
1. Add to Chart:
- Simply apply the indicator to any chart and timeframe.
- Adjust the Fibonacci periods and styling under the indicator settings.
2. Interpretation:
- Each forecast line shows where price could potentially head if the current momentum (distance from the SMA) continues.
- When multiple lines are consistently above (or below) the current price, it may reinforce a bullish (or bearish) outlook.
3. Customization:
- You can modify the number of forecast lines, their color, and line width in the inputs.
- Change or add your own Fibonacci periods to experiment with different intervals.
Notes and Best Practices
- Confirmation Tool: This indicator is best used alongside other forms of technical or fundamental analysis. It provides a “what-if” scenario based on current momentum, not a guaranteed prediction.
- Not Financial Advice: Past performance doesn’t guarantee future results. Always practice proper risk management and consider multiple indicators or market factors before making trading decisions.
Give it a try, and see if these Fibonacci-based projections help visualize where price may be headed in your trading strategy!
릴리즈 노트
additional fib MAs릴리즈 노트
got rid of redundant functionality릴리즈 노트
add angular projection릴리즈 노트
difference projection릴리즈 노트
now forecasts reversals as well릴리즈 노트
linear time intervals릴리즈 노트
add ADX reversal conditions릴리즈 노트
ADX-ATR weighting, golden ratio interval spacing, pivots릴리즈 노트
better functionality오픈 소스 스크립트
트레이딩뷰의 진정한 정신에 따라, 이 스크립트의 작성자는 이를 오픈소스로 공개하여 트레이더들이 기능을 검토하고 검증할 수 있도록 했습니다. 작성자에게 찬사를 보냅니다! 이 코드는 무료로 사용할 수 있지만, 코드를 재게시하는 경우 하우스 룰이 적용된다는 점을 기억하세요.
면책사항
해당 정보와 게시물은 금융, 투자, 트레이딩 또는 기타 유형의 조언이나 권장 사항으로 간주되지 않으며, 트레이딩뷰에서 제공하거나 보증하는 것이 아닙니다. 자세한 내용은 이용 약관을 참조하세요.
오픈 소스 스크립트
트레이딩뷰의 진정한 정신에 따라, 이 스크립트의 작성자는 이를 오픈소스로 공개하여 트레이더들이 기능을 검토하고 검증할 수 있도록 했습니다. 작성자에게 찬사를 보냅니다! 이 코드는 무료로 사용할 수 있지만, 코드를 재게시하는 경우 하우스 룰이 적용된다는 점을 기억하세요.
면책사항
해당 정보와 게시물은 금융, 투자, 트레이딩 또는 기타 유형의 조언이나 권장 사항으로 간주되지 않으며, 트레이딩뷰에서 제공하거나 보증하는 것이 아닙니다. 자세한 내용은 이용 약관을 참조하세요.