INVITE-ONLY SCRIPT
업데이트됨 BANK NIFTY ALGO
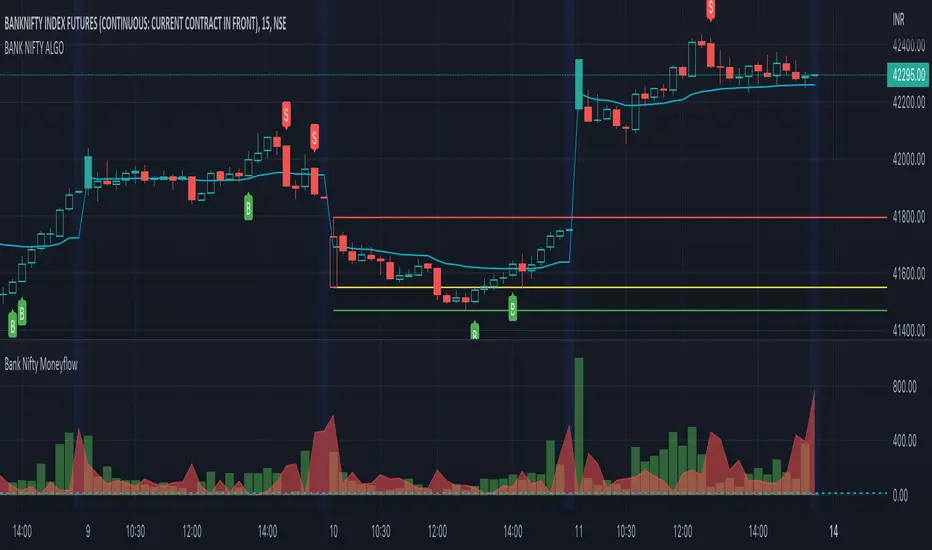
This indicator is specifically designed for trading Bank Nifty (NSE) for intraday trading & short term swing trading
Description :
This indicator is based on Price Action Theory, Volume Profiles and Moneyflow Analytics. It also incorporates important parameters of the underlying assets such as Banking stocks & key benchmark banking metrics. It shows the bias of the index at any given point of time.
USP: It reacts to change in price momentum if that is sustainable; thereby eliminating random spikes & offshoots in price. This is much more conservative way of trading & gives signal only when the trend is strongly stabilized.
How to use ?
Timeframe : Time duration for each bar (Input to given to the indicator by user)
Notations used in the indicator:
B- Signal for Buy
S- Signal for Sell
CS- Close Shorts
CL- Close Longs
BookLong- Book all Longs
BookShort- Book all Shorts
Critical Pivot is a point which is defined as the boundary of bullish & bearish sides. This is the thick line which changes color green to maroon to grey. It gives an idea of bias in the market. Green color is for Bullish bias, Maroon for Bearish bias & Grey for Neutral
Swing High: The dynamic green line at the end of the charts
Swing Low : The dynamic red line at the end of the charts
Major uses of the Indicator:
1. Understanding the direction of Bank Nifty and understands levels for entry / exits --- B & S signals
2. Understanding SL levels in order to prevent loss during unforeseen events ------------- Break of the critical pivot ( green/maroon line )
3. Understanding Trailing SL levels to hold on to the winners --------------------------------- Break of the Green/Red Line
Ideal Timeframes for this Indicator :
1.Intraday ( 5 min/15 mins )
2.Swing ( 30 mins/1 hour)
Disclaimer: This script/strategy is for educational purpose and individual use only. The author of this script/strategy will not accept any liability for loss or damage as a result of reliance on the information contained in the charts. Please be fully informed regarding the risks associated with trading the financial markets.
This is a premium indicator
If you want access to this indicator, please message us (Links/Email in description below )
릴리즈 노트
Updated with changes in bnf constituents 릴리즈 노트
Weights updated 릴리즈 노트
Weights updated 릴리즈 노트
..릴리즈 노트
Updated weights 초대 전용 스크립트
이 스크립트는 작성자가 승인한 사용자만 접근할 수 있습니다. 사용하려면 요청 후 승인을 받아야 하며, 일반적으로 결제 후에 허가가 부여됩니다. 자세한 내용은 아래 작성자의 안내를 따르거나 aditya_biswas에게 직접 문의하세요.
트레이딩뷰는 스크립트의 작동 방식을 충분히 이해하고 작성자를 완전히 신뢰하지 않는 이상, 해당 스크립트에 비용을 지불하거나 사용하는 것을 권장하지 않습니다. 커뮤니티 스크립트에서 무료 오픈소스 대안을 찾아보실 수도 있습니다.
작성자 지시 사항
Please send over a personal message in trading view or whatsapp for access
Coordinates :
Detailed demo/Live replay : youtube.com/channel/UC79RlSqRn85th7zgpZpz3Iw
email : quantumtradingsystem@gmail.com
Detailed demo/Live replay : youtube.com/channel/UC79RlSqRn85th7zgpZpz3Iw
email : quantumtradingsystem@gmail.com
면책사항
해당 정보와 게시물은 금융, 투자, 트레이딩 또는 기타 유형의 조언이나 권장 사항으로 간주되지 않으며, 트레이딩뷰에서 제공하거나 보증하는 것이 아닙니다. 자세한 내용은 이용 약관을 참조하세요.
초대 전용 스크립트
이 스크립트는 작성자가 승인한 사용자만 접근할 수 있습니다. 사용하려면 요청 후 승인을 받아야 하며, 일반적으로 결제 후에 허가가 부여됩니다. 자세한 내용은 아래 작성자의 안내를 따르거나 aditya_biswas에게 직접 문의하세요.
트레이딩뷰는 스크립트의 작동 방식을 충분히 이해하고 작성자를 완전히 신뢰하지 않는 이상, 해당 스크립트에 비용을 지불하거나 사용하는 것을 권장하지 않습니다. 커뮤니티 스크립트에서 무료 오픈소스 대안을 찾아보실 수도 있습니다.
작성자 지시 사항
Please send over a personal message in trading view or whatsapp for access
Coordinates :
Detailed demo/Live replay : youtube.com/channel/UC79RlSqRn85th7zgpZpz3Iw
email : quantumtradingsystem@gmail.com
Detailed demo/Live replay : youtube.com/channel/UC79RlSqRn85th7zgpZpz3Iw
email : quantumtradingsystem@gmail.com
면책사항
해당 정보와 게시물은 금융, 투자, 트레이딩 또는 기타 유형의 조언이나 권장 사항으로 간주되지 않으며, 트레이딩뷰에서 제공하거나 보증하는 것이 아닙니다. 자세한 내용은 이용 약관을 참조하세요.