OPEN-SOURCE SCRIPT
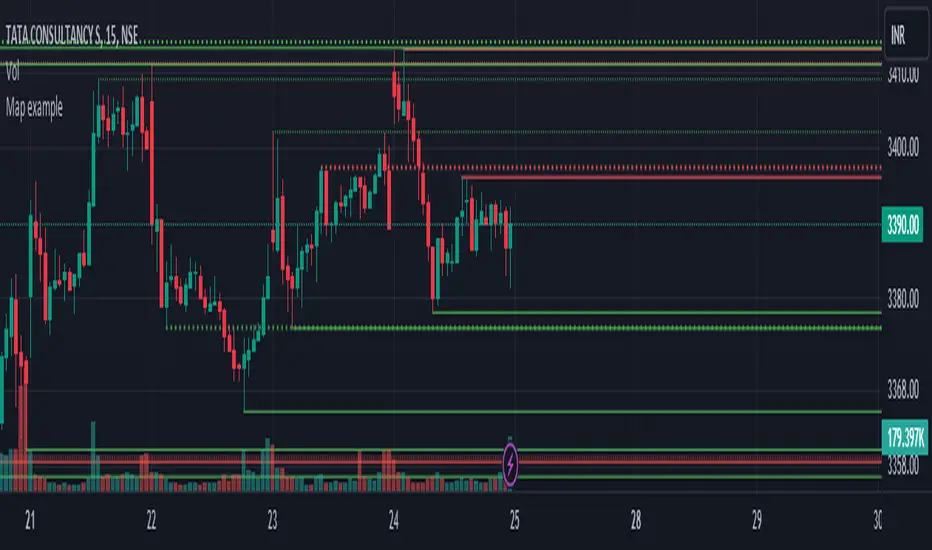
Map example
Using Maps collections:
This code manipulates support and resistance lines using maps collection.
We normally maintain array/udt of lines and related properties to segregate lines as support and or resistance.
With introduction of maps the same can be achieved without creating lines array/udt.
What does this code do:
1. Plot support and resistance lines based on ta.pivothigh() and ta.pivotlow()
2. When price crosses support line, the line is marked as resistance and color is changed to resistance line color and style is changed to dotted line (support turned resistance). Also the width of the line is set based on number of crosses. Finally the support/resistance line is removed when number of times price crossing the line reaches max allowed crosses (input parameter)
Where maps are used:
1. map_sr_cross - Number of times the support/resistance lines has been crossed by price
2. map_sr_type - R=resistance, S=support
3. color_map - color for support and resistance lines
4. style_map - line styles. Support/resistance lines as solid style and support turned resistance/resistance turned support lines as dotted style.
오픈 소스 스크립트
트레이딩뷰의 진정한 정신에 따라, 이 스크립트의 작성자는 이를 오픈소스로 공개하여 트레이더들이 기능을 검토하고 검증할 수 있도록 했습니다. 작성자에게 찬사를 보냅니다! 이 코드는 무료로 사용할 수 있지만, 코드를 재게시하는 경우 하우스 룰이 적용된다는 점을 기억하세요.
면책사항
해당 정보와 게시물은 금융, 투자, 트레이딩 또는 기타 유형의 조언이나 권장 사항으로 간주되지 않으며, 트레이딩뷰에서 제공하거나 보증하는 것이 아닙니다. 자세한 내용은 이용 약관을 참조하세요.
오픈 소스 스크립트
트레이딩뷰의 진정한 정신에 따라, 이 스크립트의 작성자는 이를 오픈소스로 공개하여 트레이더들이 기능을 검토하고 검증할 수 있도록 했습니다. 작성자에게 찬사를 보냅니다! 이 코드는 무료로 사용할 수 있지만, 코드를 재게시하는 경우 하우스 룰이 적용된다는 점을 기억하세요.
면책사항
해당 정보와 게시물은 금융, 투자, 트레이딩 또는 기타 유형의 조언이나 권장 사항으로 간주되지 않으며, 트레이딩뷰에서 제공하거나 보증하는 것이 아닙니다. 자세한 내용은 이용 약관을 참조하세요.