INVITE-ONLY SCRIPT
D Indicators - Positional tool
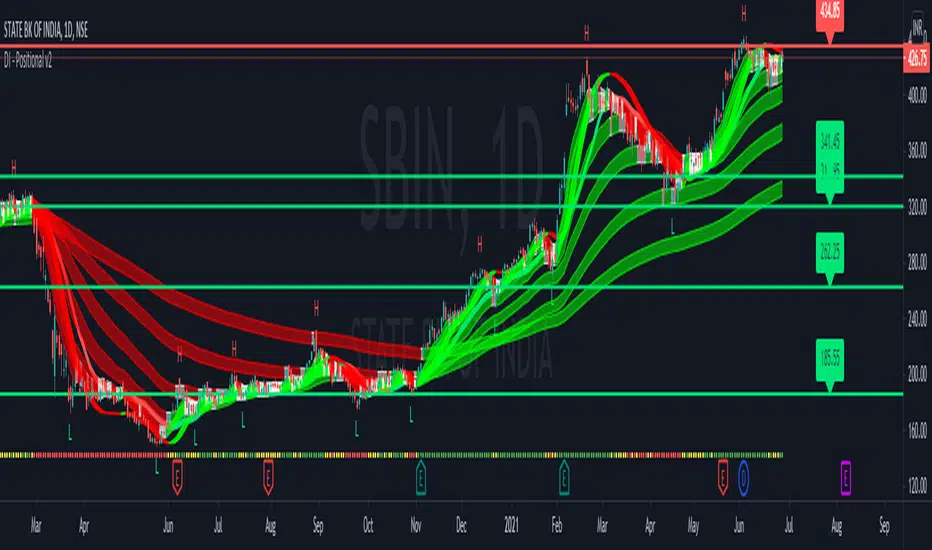
*Presenting a perfect setup for Positional and Swing traders.
1) Slow and Fast Bands
# 3 fast and 3 slow, in total of 6 EMA bands are added to the indicator in order
to make accurate decisions and helping find out in which trend the price is.
Enter when price gives a breakout above or below all of the 6 bands.
2) Trend Indicators
# Total of 3 trend indicators are also included:
Trend Indicator 1 ---> It is a SMA(20) and its color changes based upon
Trend Indicator 2 ---> will be plotted at the bottom of the screen. Based upon RSI
Trend Indicator 3 ----> EHMA
Their color will be yellow whenever the market is sideways which will act
as a cautionary sign that in about next phase the price will be rangebound.
Use them as a helping hand, and check whether they show the same trend or not while you enter.
3) Support/Resistance lines
# On charts, this indicator is used to locate levels of support and resistance.
As a function, Targets and SL can be planned.
When a candle closes above the support/resistance line, the lines change
color automatically. It'll turn green.
If the price is below the sup, it will also change color to red.
4) High/Low
# Will mark the high/low of a particular swing so that, one can place the SL over there and enter.
Thank you and regards,
D Indicators
초대 전용 스크립트
이 스크립트는 작성자가 승인한 사용자만 접근할 수 있습니다. 사용하려면 요청 후 승인을 받아야 하며, 일반적으로 결제 후에 허가가 부여됩니다. 자세한 내용은 아래 작성자의 안내를 따르거나 D_Indicators에게 직접 문의하세요.
트레이딩뷰는 스크립트의 작동 방식을 충분히 이해하고 작성자를 완전히 신뢰하지 않는 이상, 해당 스크립트에 비용을 지불하거나 사용하는 것을 권장하지 않습니다. 커뮤니티 스크립트에서 무료 오픈소스 대안을 찾아보실 수도 있습니다.
작성자 지시 사항
For access, please contact us. 📞: +91 - 7984128073 WhatsApp: https://wa.me/message/PWOK6HXQWJ6LF1 Telegram: http://t.me/dindicators1
면책사항
해당 정보와 게시물은 금융, 투자, 트레이딩 또는 기타 유형의 조언이나 권장 사항으로 간주되지 않으며, 트레이딩뷰에서 제공하거나 보증하는 것이 아닙니다. 자세한 내용은 이용 약관을 참조하세요.