OPEN-SOURCE SCRIPT
업데이트됨 Grover Llorens Cycle Oscillator [alexgrover & Lucía Llorens]
Cycles represent relatively smooth fluctuations with mean 0 and of varying period and amplitude, their estimation using technical indicators has always been a major task. In the additive model of price, the cycle is a component :
Price = Trend + Cycle + Noise
Based on this model we can deduce that :
Cycle = Price - Trend - Noise
The indicators specialized on the estimation of cycles are oscillators, some like bandpass filters aim to return a correct estimate of the cycles, while others might only show a deformation of them, this can be done in order to maximize the visualization of the cycles.
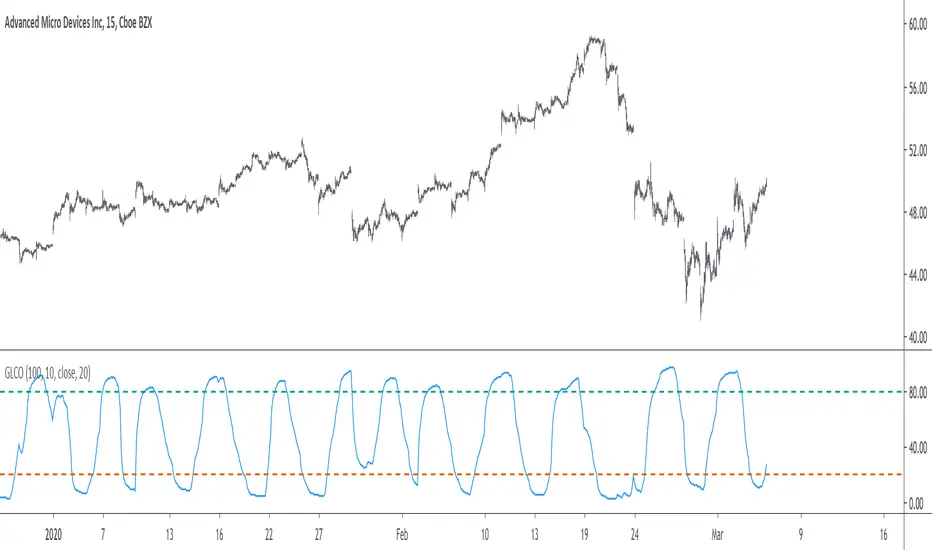
Today an oscillator who aim to maximize the visualization of the cycles is presented, the oscillator is based on the difference between the price and the previously proposed Grover Llorens activator indicator. A relative strength index is then applied to this difference in order to minimize the change of amplitude in the cycles.
![Grover Llorens Activator [alexgrover & Lucía Llorens]](https://s3.tradingview.com/u/UVzC9TOv_mid.png)
The Indicator
The indicator include the length and mult settings used by the Grover Llorens activator. Length control the rate of convergence of the activator, lower values of length will output cycles of a faster period.

here length = 50
Mult is responsible for maximizing the visualization of the cycles, low values of mult will return a less cyclical output.

Here mult = 1
Finally you can smooth the indicator output if you want (smooth by default), you can uncheck the option if you want a noisy output.

The smoothing amount is also linked with the period of the rsi.

Here the smoothing amount = 100.
Conclusion
An oscillator based on the recently posted Grover Llorens activator has been proposed. The oscillator aim to maximize the visualization of cycles.
Maximizing the visualization of cycles don't comes with no cost, the indicator output can be uncorrelated with the actual cycles or can return cycles that are not present in the price. Other problems arises from the indicator settings, because cycles are of a time-varying periods it isn't optimal to use fixed length oscillators for their estimation.
Thanks for reading !
If my work has ever been of use to you you can donate, addresses on my signature :)
Price = Trend + Cycle + Noise
Based on this model we can deduce that :
Cycle = Price - Trend - Noise
The indicators specialized on the estimation of cycles are oscillators, some like bandpass filters aim to return a correct estimate of the cycles, while others might only show a deformation of them, this can be done in order to maximize the visualization of the cycles.
Today an oscillator who aim to maximize the visualization of the cycles is presented, the oscillator is based on the difference between the price and the previously proposed Grover Llorens activator indicator. A relative strength index is then applied to this difference in order to minimize the change of amplitude in the cycles.
The Indicator
The indicator include the length and mult settings used by the Grover Llorens activator. Length control the rate of convergence of the activator, lower values of length will output cycles of a faster period.
here length = 50
Mult is responsible for maximizing the visualization of the cycles, low values of mult will return a less cyclical output.
Here mult = 1
Finally you can smooth the indicator output if you want (smooth by default), you can uncheck the option if you want a noisy output.
The smoothing amount is also linked with the period of the rsi.
Here the smoothing amount = 100.
Conclusion
An oscillator based on the recently posted Grover Llorens activator has been proposed. The oscillator aim to maximize the visualization of cycles.
Maximizing the visualization of cycles don't comes with no cost, the indicator output can be uncorrelated with the actual cycles or can return cycles that are not present in the price. Other problems arises from the indicator settings, because cycles are of a time-varying periods it isn't optimal to use fixed length oscillators for their estimation.
Thanks for reading !
If my work has ever been of use to you you can donate, addresses on my signature :)
릴리즈 노트
Fixed repainting issues오픈 소스 스크립트
트레이딩뷰의 진정한 정신에 따라, 이 스크립트의 작성자는 이를 오픈소스로 공개하여 트레이더들이 기능을 검토하고 검증할 수 있도록 했습니다. 작성자에게 찬사를 보냅니다! 이 코드는 무료로 사용할 수 있지만, 코드를 재게시하는 경우 하우스 룰이 적용된다는 점을 기억하세요.
Check out the indicators we are making at luxalgo: tradingview.com/u/LuxAlgo/
"My heart is so loud that I can't hear the fireworks"
"My heart is so loud that I can't hear the fireworks"
면책사항
해당 정보와 게시물은 금융, 투자, 트레이딩 또는 기타 유형의 조언이나 권장 사항으로 간주되지 않으며, 트레이딩뷰에서 제공하거나 보증하는 것이 아닙니다. 자세한 내용은 이용 약관을 참조하세요.
오픈 소스 스크립트
트레이딩뷰의 진정한 정신에 따라, 이 스크립트의 작성자는 이를 오픈소스로 공개하여 트레이더들이 기능을 검토하고 검증할 수 있도록 했습니다. 작성자에게 찬사를 보냅니다! 이 코드는 무료로 사용할 수 있지만, 코드를 재게시하는 경우 하우스 룰이 적용된다는 점을 기억하세요.
Check out the indicators we are making at luxalgo: tradingview.com/u/LuxAlgo/
"My heart is so loud that I can't hear the fireworks"
"My heart is so loud that I can't hear the fireworks"
면책사항
해당 정보와 게시물은 금융, 투자, 트레이딩 또는 기타 유형의 조언이나 권장 사항으로 간주되지 않으며, 트레이딩뷰에서 제공하거나 보증하는 것이 아닙니다. 자세한 내용은 이용 약관을 참조하세요.