PROTECTED SOURCE SCRIPT
업데이트됨 Nifty SentiMeter
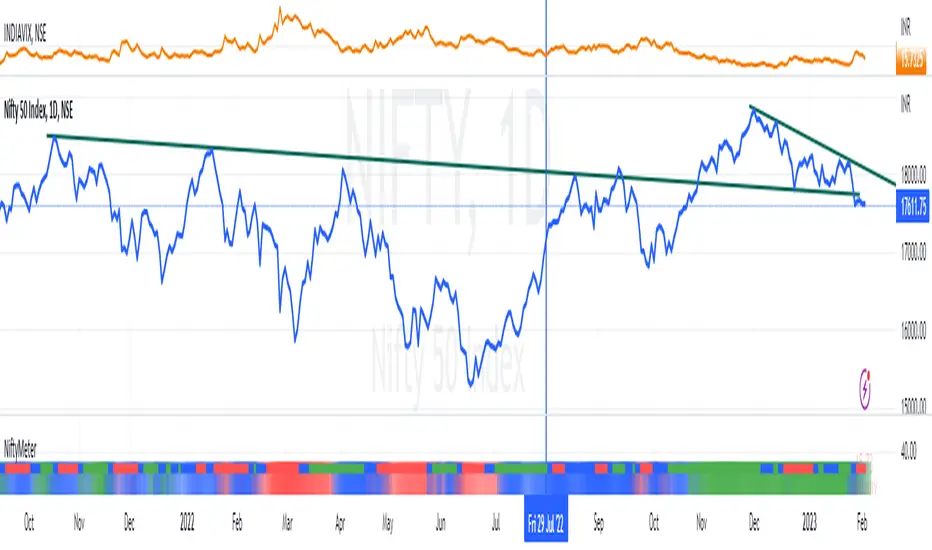
This meter displays a colour code based sentiment for the Nifty50 Index.
In order to do so, it uses the IndiaVix, that is the standard for determining the broader market Investor sentiment. The IndiaVix and the Nifty50 are inversely correlated. A spiking Vix on the upside indicates panic and fear in the market, that is reflected in price of the Nifty50, usually accompanied by steep falls. On the other hand, a stabilised and low volatile Vix, creates an atmosphere conducive for positive investor activity.
This indicator, uses this concept of inverse correlation between the Vix and the Benchmark, to plot the changes of investor sentiments over a period of time and the current sentiment.
This indicator should be used only on the DAILY timeframe for best results.
The best way to analyse the NiftyMeter is to observe the colour changes, that will help in understanding the changing investor sentiments.
A quick guide is as follows:
In general, Red indicates fear, Blue indicates a transitioning phase of sentiment (bull to bear or bear to bull), Green indicates bullish sentiment.
A stronger shade of the colour will indicate a stronger sentiment.
In order to do so, it uses the IndiaVix, that is the standard for determining the broader market Investor sentiment. The IndiaVix and the Nifty50 are inversely correlated. A spiking Vix on the upside indicates panic and fear in the market, that is reflected in price of the Nifty50, usually accompanied by steep falls. On the other hand, a stabilised and low volatile Vix, creates an atmosphere conducive for positive investor activity.
This indicator, uses this concept of inverse correlation between the Vix and the Benchmark, to plot the changes of investor sentiments over a period of time and the current sentiment.
This indicator should be used only on the DAILY timeframe for best results.
The best way to analyse the NiftyMeter is to observe the colour changes, that will help in understanding the changing investor sentiments.
A quick guide is as follows:
- Blue to Red, Green to Red - Indicates the positive investor sentiment has turned into bear - fear.
- Red and getting Stronger Red - Indicates that the fear is sustained.
- Blue to Green, Red to Green - Indicates that positive investor sentiment is back. It is now time for bulls to be active again.
In general, Red indicates fear, Blue indicates a transitioning phase of sentiment (bull to bear or bear to bull), Green indicates bullish sentiment.
A stronger shade of the colour will indicate a stronger sentiment.
릴리즈 노트
- Some clean up
- Added a "Fast" check over the existing "Slow"
보호된 스크립트입니다
이 스크립트는 비공개 소스로 게시됩니다. 하지만 이를 자유롭게 제한 없이 사용할 수 있습니다 – 자세한 내용은 여기에서 확인하세요.
면책사항
해당 정보와 게시물은 금융, 투자, 트레이딩 또는 기타 유형의 조언이나 권장 사항으로 간주되지 않으며, 트레이딩뷰에서 제공하거나 보증하는 것이 아닙니다. 자세한 내용은 이용 약관을 참조하세요.
보호된 스크립트입니다
이 스크립트는 비공개 소스로 게시됩니다. 하지만 이를 자유롭게 제한 없이 사용할 수 있습니다 – 자세한 내용은 여기에서 확인하세요.
면책사항
해당 정보와 게시물은 금융, 투자, 트레이딩 또는 기타 유형의 조언이나 권장 사항으로 간주되지 않으며, 트레이딩뷰에서 제공하거나 보증하는 것이 아닙니다. 자세한 내용은 이용 약관을 참조하세요.