OPEN-SOURCE SCRIPT
업데이트됨 Normalized Dist from 4H MA200 + Chart Highlights
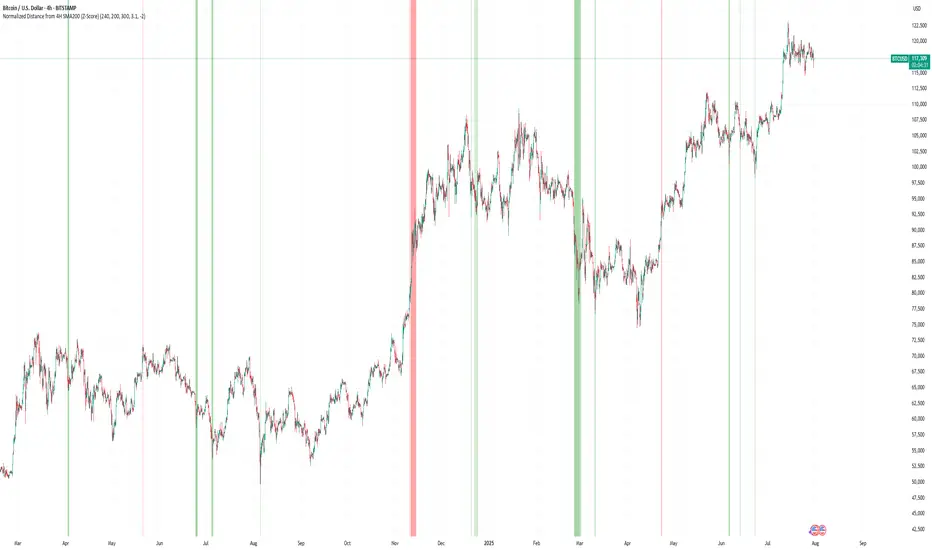
Normalized Distance from 4H EMA200 + Highlighting Extremes
This indicator measures the distance between the current price and the 4-hour EMA200, normalized into a z-score to detect statistically significant deviations.
🔹 The lower pane shows the normalized z-score.
🔹 Green background = price far below EMA200 (z < -2).
🔹 Red background = price far above EMA200 (z > 3.1).
🔹 These thresholds are user-configurable.
🔹 On the main chart:
🟥 Red candles indicate overheated prices (z > upper threshold)
🟩 Green candles signal oversold conditions (z < lower threshold)
The EMA200 is always taken from a fixed 4H timeframe, regardless of your current chart resolution.
릴리즈 노트
Normalized Distance from 4H EMA200 + Highlighting ExtremesThis indicator measures the distance between the current price and the 4-hour EMA200, normalized into a z-score to detect statistically significant deviations.
🔹 The lower pane shows the normalized z-score.
🔹 Green background = price far below EMA200 (z < -2).
🔹 Red background = price far above EMA200 (z > 3.1).
🔹 These thresholds are user-configurable.
🔹 On the main chart:
🟥 Red candles indicate overheated prices (z > upper threshold)
🟩 Green candles signal oversold conditions (z < lower threshold)
The EMA200 is always taken from a fixed 4H timeframe, regardless of your current chart resolution.
오픈 소스 스크립트
트레이딩뷰의 진정한 정신에 따라, 이 스크립트의 작성자는 이를 오픈소스로 공개하여 트레이더들이 기능을 검토하고 검증할 수 있도록 했습니다. 작성자에게 찬사를 보냅니다! 이 코드는 무료로 사용할 수 있지만, 코드를 재게시하는 경우 하우스 룰이 적용된다는 점을 기억하세요.
면책사항
해당 정보와 게시물은 금융, 투자, 트레이딩 또는 기타 유형의 조언이나 권장 사항으로 간주되지 않으며, 트레이딩뷰에서 제공하거나 보증하는 것이 아닙니다. 자세한 내용은 이용 약관을 참조하세요.
오픈 소스 스크립트
트레이딩뷰의 진정한 정신에 따라, 이 스크립트의 작성자는 이를 오픈소스로 공개하여 트레이더들이 기능을 검토하고 검증할 수 있도록 했습니다. 작성자에게 찬사를 보냅니다! 이 코드는 무료로 사용할 수 있지만, 코드를 재게시하는 경우 하우스 룰이 적용된다는 점을 기억하세요.
면책사항
해당 정보와 게시물은 금융, 투자, 트레이딩 또는 기타 유형의 조언이나 권장 사항으로 간주되지 않으며, 트레이딩뷰에서 제공하거나 보증하는 것이 아닙니다. 자세한 내용은 이용 약관을 참조하세요.