OPEN-SOURCE SCRIPT
업데이트됨 Collective Indicator
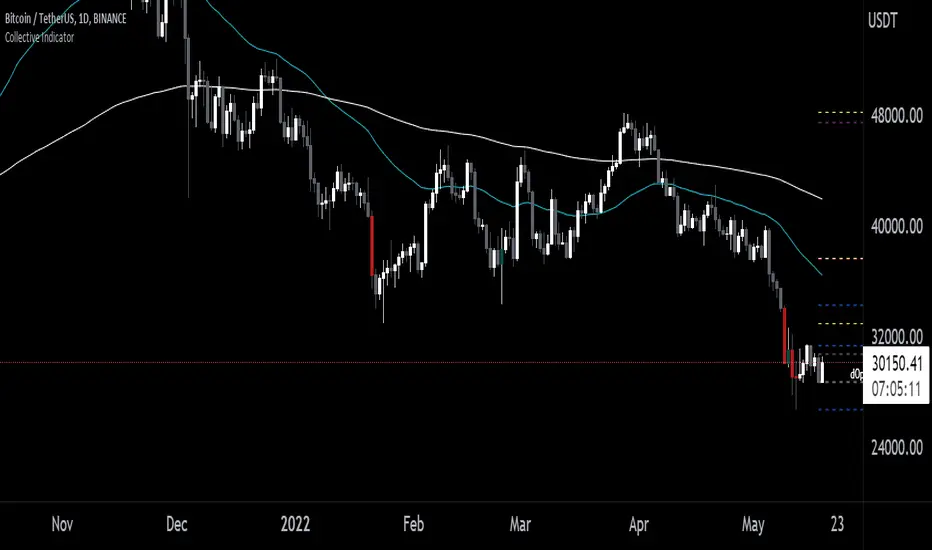
Key notes are that this indicators markets the High and Low of the previous day, week month and quarter. It also marks the open of the day, week, month and quarter. These are levels that can be important areas to take trades towards and away from.
It includes additional features some may wish to use that I've included for your convenience that I don't personally use anymore. This is the 50 and 200 EMAs and high volume candle coloring. EMAs can be helpful for identifying the average markup and markdown of a a trend on any given timeframe. Be careful with mean reversion strategies alone since they tend not to have great entries and could result in high losses if used in isolation.
The "Length" and "High Volume" settings control how the coloration of candles is applied. Length is the amount of bars it will use to calculate a volume average. "High Volume" is the multiplier used to distinguish how much additional volume you want to be considered "high" volume. 1x meaning average 2x meaning double volume and etc.
High volume identification can help show distributive or accumulative characteristics around key areas.
I personally focus on the Open, Low, High close data, apply SMC concepts and Wyckoff concepts to look for trades around these key areas.
릴리즈 노트
added 5/13 ema options오픈 소스 스크립트
트레이딩뷰의 진정한 정신에 따라, 이 스크립트의 작성자는 이를 오픈소스로 공개하여 트레이더들이 기능을 검토하고 검증할 수 있도록 했습니다. 작성자에게 찬사를 보냅니다! 이 코드는 무료로 사용할 수 있지만, 코드를 재게시하는 경우 하우스 룰이 적용된다는 점을 기억하세요.
면책사항
해당 정보와 게시물은 금융, 투자, 트레이딩 또는 기타 유형의 조언이나 권장 사항으로 간주되지 않으며, 트레이딩뷰에서 제공하거나 보증하는 것이 아닙니다. 자세한 내용은 이용 약관을 참조하세요.
오픈 소스 스크립트
트레이딩뷰의 진정한 정신에 따라, 이 스크립트의 작성자는 이를 오픈소스로 공개하여 트레이더들이 기능을 검토하고 검증할 수 있도록 했습니다. 작성자에게 찬사를 보냅니다! 이 코드는 무료로 사용할 수 있지만, 코드를 재게시하는 경우 하우스 룰이 적용된다는 점을 기억하세요.
면책사항
해당 정보와 게시물은 금융, 투자, 트레이딩 또는 기타 유형의 조언이나 권장 사항으로 간주되지 않으며, 트레이딩뷰에서 제공하거나 보증하는 것이 아닙니다. 자세한 내용은 이용 약관을 참조하세요.