OPEN-SOURCE SCRIPT
Position Sizer by Volatility
Description:
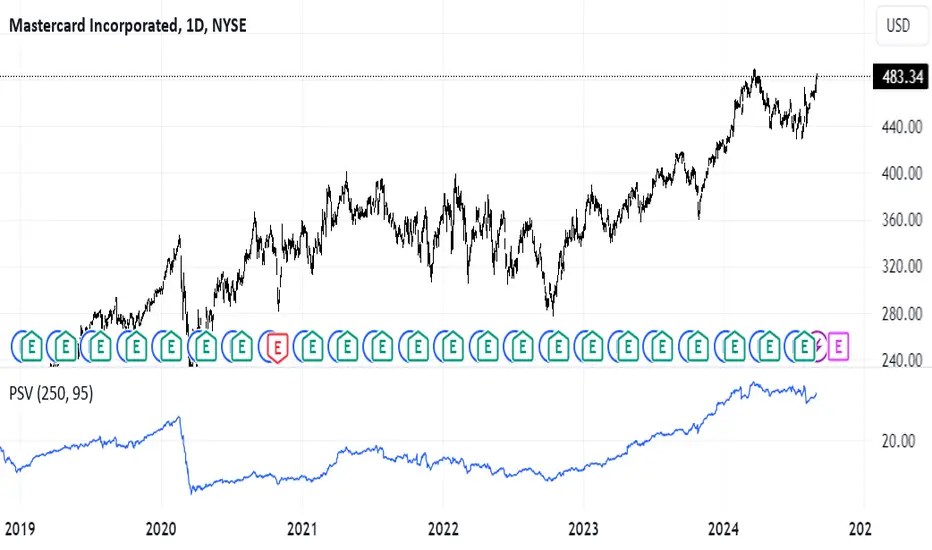
The **Position Sizer by Volatility (PSV)** is an indicator that helps traders determine what percentage of their deposit a position will occupy, taking into account the current market volatility. PSV calculates the range of price movements over recent periods and shows how large this movement is compared to historical data. The lower the value, the lower the volatility, and the smaller the stop-loss required relative to the current price.
Explanation of PSV Parameters:
- `len` (Period Length):** This parameter sets the number of candles (bars) on the chart that will be used to calculate volatility. For example, if `len` is set to 250, the indicator will analyze price movements over the last 250 bars. The larger the value, the longer the period used for volatility assessment.
- `percent` (Percentile):** This parameter determines how strong price fluctuations you want to account for. For instance, if you set `percent` to 95, the indicator will focus on the 5% of instances where the price range was the largest over the specified period. This helps evaluate volatility during periods of sharp price movements, which may require a larger stop-loss. A higher percentile accounts for rarer but stronger movements, and vice versa.
오픈 소스 스크립트
트레이딩뷰의 진정한 정신에 따라, 이 스크립트의 작성자는 이를 오픈소스로 공개하여 트레이더들이 기능을 검토하고 검증할 수 있도록 했습니다. 작성자에게 찬사를 보냅니다! 이 코드는 무료로 사용할 수 있지만, 코드를 재게시하는 경우 하우스 룰이 적용된다는 점을 기억하세요.
면책사항
해당 정보와 게시물은 금융, 투자, 트레이딩 또는 기타 유형의 조언이나 권장 사항으로 간주되지 않으며, 트레이딩뷰에서 제공하거나 보증하는 것이 아닙니다. 자세한 내용은 이용 약관을 참조하세요.
오픈 소스 스크립트
트레이딩뷰의 진정한 정신에 따라, 이 스크립트의 작성자는 이를 오픈소스로 공개하여 트레이더들이 기능을 검토하고 검증할 수 있도록 했습니다. 작성자에게 찬사를 보냅니다! 이 코드는 무료로 사용할 수 있지만, 코드를 재게시하는 경우 하우스 룰이 적용된다는 점을 기억하세요.
면책사항
해당 정보와 게시물은 금융, 투자, 트레이딩 또는 기타 유형의 조언이나 권장 사항으로 간주되지 않으며, 트레이딩뷰에서 제공하거나 보증하는 것이 아닙니다. 자세한 내용은 이용 약관을 참조하세요.