OPEN-SOURCE SCRIPT
업데이트됨 Single Prints and Poor Highs/Lows [Real-Time]
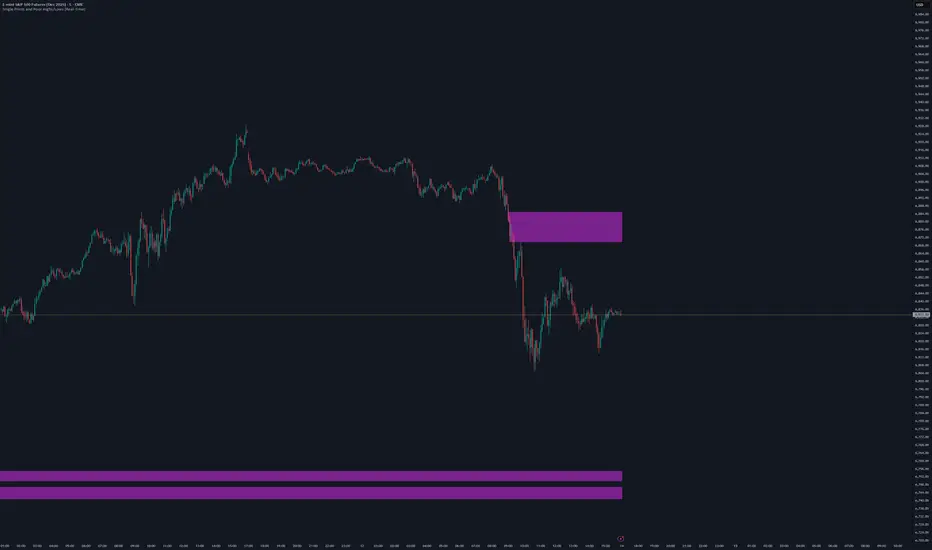
This indicator is designed for traders utilizing Auction Market Theory (AMT) who need real-time visibility into market structure inefficiencies. Unlike standard TPO tools that often wait for closed bars or finished sessions, this script builds a developing TPO profile tick-by-tick to identify Single Prints and Poor Highs/Lows the moment they form.
Key Features:
Real-Time Single Prints: Automatically detects and highlights areas of single-print inefficiencies (buying/selling tails) as they happen. These "ghost" boxes persist on the chart until price repairs (fills) them, acting as immediate targets or support/resistance zones.
Poor High/Low Detection: Strictly implements AMT logic to identify "unfinished" auctions. If a session extreme is formed by two or more TPO blocks (indicating a flat top/bottom rather than a rejection tail), it marks the level with a dotted line.
Repair Logic: Both Single Prints and Poor High/Low lines are dynamic. If price revisits and repairs the structure, the markers automatically vanish to keep your chart clean.
Session Control: Fully customizable RTH (Regular Trading Hours) session input (default 08:30–15:15) to ensure profiles are built on relevant liquidity.
Quantization: Adjustable "Ticks per Block" allowing you to tune the sensitivity of the TPO profile to different assets (ES, NQ, CL, etc.).
How It Works:
TPO Construction: The script breaks the session into 30-minute periods (configurable) and tracks price overlap.
Single Prints: When the market expands rapidly, leaving gaps in the profile (single TPO blocks), a box is drawn. If price trades back through this box, it deletes itself.
Poor Extremes: It monitors the current session High and Low. If the extreme price level has a TPO count of ≥ 2, it is flagged as "Poor." If the extreme is a single print (count = 1), it is considered a valid tail and left unmarked.
Settings:
RTH Session: Define your specific trading session time.
TPO Period: Default is 30 minutes (standard AMT).
Ticks per Block: Controls the vertical resolution of the TPO. (Higher values = coarser profile, Lower values = more precision).
Colors: Fully customizable colors for Live Prints, Historical Prints, and Poor High/Low lines.
Usage:
Use this tool to spot immediate structural targets. A Poor High often acts as a magnet for price to revisit and "repair," while Single Prints often defend as support/resistance on the first retest.
릴리즈 노트
Disclaimer: This tool is for informational purposes only. Past performance does not guarantee future results.릴리즈 노트
fixed a minor issue with the line where it wasn't extended back correctly to the point of origin. now the line start at where the poor high/low appeared and remains on the chart until the poor high/low is repaired오픈 소스 스크립트
트레이딩뷰의 진정한 정신에 따라, 이 스크립트의 작성자는 이를 오픈소스로 공개하여 트레이더들이 기능을 검토하고 검증할 수 있도록 했습니다. 작성자에게 찬사를 보냅니다! 이 코드는 무료로 사용할 수 있지만, 코드를 재게시하는 경우 하우스 룰이 적용된다는 점을 기억하세요.
면책사항
해당 정보와 게시물은 금융, 투자, 트레이딩 또는 기타 유형의 조언이나 권장 사항으로 간주되지 않으며, 트레이딩뷰에서 제공하거나 보증하는 것이 아닙니다. 자세한 내용은 이용 약관을 참조하세요.
오픈 소스 스크립트
트레이딩뷰의 진정한 정신에 따라, 이 스크립트의 작성자는 이를 오픈소스로 공개하여 트레이더들이 기능을 검토하고 검증할 수 있도록 했습니다. 작성자에게 찬사를 보냅니다! 이 코드는 무료로 사용할 수 있지만, 코드를 재게시하는 경우 하우스 룰이 적용된다는 점을 기억하세요.
면책사항
해당 정보와 게시물은 금융, 투자, 트레이딩 또는 기타 유형의 조언이나 권장 사항으로 간주되지 않으며, 트레이딩뷰에서 제공하거나 보증하는 것이 아닙니다. 자세한 내용은 이용 약관을 참조하세요.