OPEN-SOURCE SCRIPT
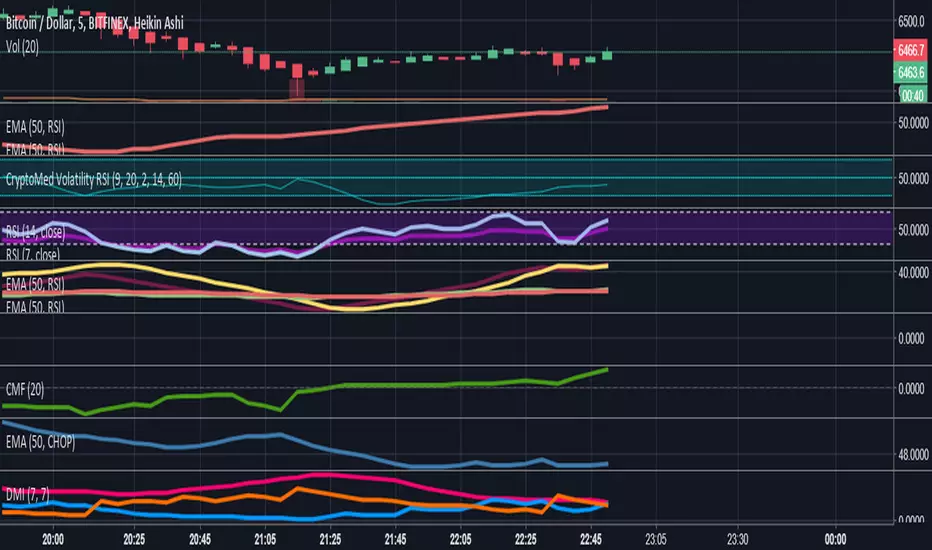
CryptoMedication's Volatility RSI
So, here's what we ended up doing for the most recent one that we created.
1. We took the ATR (Average True Range) - You can read about that here: medium.com/thedailydose/average-true-range-atr-lesson-26ee37c599cd
2. Then applied the Bollinger Bands %B to it
3. Then overlayed it with another indicator
Purpose:
The general purpose of this indicator is to identify when there are periods of consolidation or if there were be a large increase in the price (going either way). However, we were able to plug this in so that it connected with the RSI (after cancelling out the noise and smoothing values*making it scaled out evenly), so that it also produces buy/sell signals.
If you're interested to get a more in-depth overview of how this works, visit this link here: medium.com/thedailydose/cryptomedication-volatility-rsi-72d6dcc2d8bb
오픈 소스 스크립트
트레이딩뷰의 진정한 정신에 따라, 이 스크립트의 작성자는 이를 오픈소스로 공개하여 트레이더들이 기능을 검토하고 검증할 수 있도록 했습니다. 작성자에게 찬사를 보냅니다! 이 코드는 무료로 사용할 수 있지만, 코드를 재게시하는 경우 하우스 룰이 적용된다는 점을 기억하세요.
면책사항
해당 정보와 게시물은 금융, 투자, 트레이딩 또는 기타 유형의 조언이나 권장 사항으로 간주되지 않으며, 트레이딩뷰에서 제공하거나 보증하는 것이 아닙니다. 자세한 내용은 이용 약관을 참조하세요.
오픈 소스 스크립트
트레이딩뷰의 진정한 정신에 따라, 이 스크립트의 작성자는 이를 오픈소스로 공개하여 트레이더들이 기능을 검토하고 검증할 수 있도록 했습니다. 작성자에게 찬사를 보냅니다! 이 코드는 무료로 사용할 수 있지만, 코드를 재게시하는 경우 하우스 룰이 적용된다는 점을 기억하세요.
면책사항
해당 정보와 게시물은 금융, 투자, 트레이딩 또는 기타 유형의 조언이나 권장 사항으로 간주되지 않으며, 트레이딩뷰에서 제공하거나 보증하는 것이 아닙니다. 자세한 내용은 이용 약관을 참조하세요.