OPEN-SOURCE SCRIPT
G-Channel Trend Detection
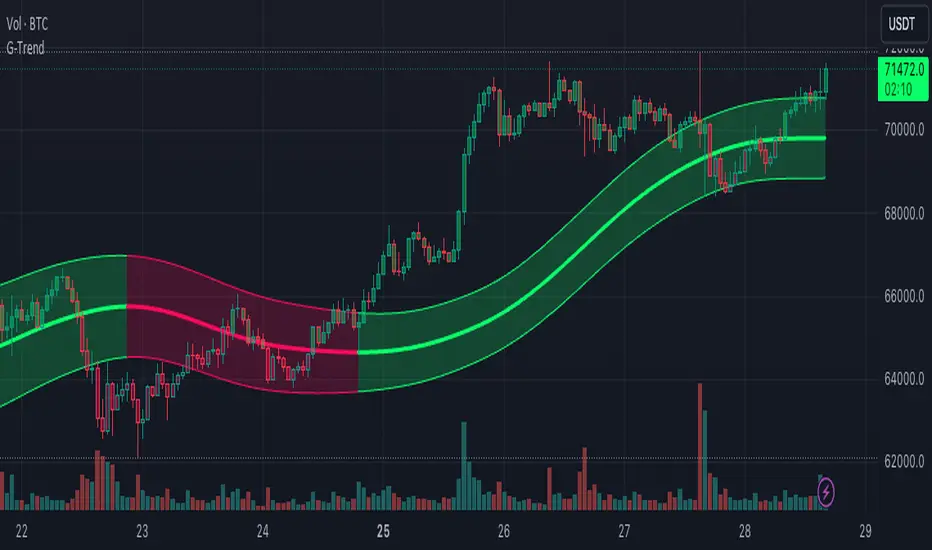
The G-Channel Trend Detection is a technical analysis indicator developed by Alex Grover. It is designed to identify and visualize the prevailing trend direction in financial markets by efficiently calculating the upper and lower extremities of price movements.
The indicator consists of a centerline (filter) and two outer bands (upper and lower bands) that adapt to the volatility of the price action. The centerline represents the core trend, while the outer bands provide dynamic support and resistance levels.
Key features of the G-Channel Trend Detection indicator:
1. Efficient calculation: The indicator uses an optimized algorithm to calculate the upper and lower extremities of price movements, providing a smooth and responsive representation of the trend.
2. Customizable parameters: Users can adjust the indicator's parameters, such as the number of poles, sampling period, and true range multiplier, to fine-tune the sensitivity and responsiveness of the bands to price changes.
3. Lag reduction: The indicator offers a reduced lag mode and a fast response mode, which help to minimize the delay between price movements and the indicator's signals, providing more timely and accurate trend detection.
4. Trend identification: The color of the centerline and the fill between the outer bands change based on the direction of the trend. An upward-sloping centerline with a green color suggests a bullish trend, while a downward-sloping centerline with a red color indicates a bearish trend.
5. Price action confirmation: The indicator also colors the price bars based on their position relative to the centerline and outer bands. This feature helps traders to confirm the strength and direction of the trend visually.
Traders can use the G-Channel Trend Detection indicator to identify the overall market trend, potential trend reversals, and to make informed trading decisions based on the direction and strength of the trend. The indicator can be used in conjunction with other technical analysis tools, such as momentum oscillators and volume indicators, to confirm signals and validate trading strategies.
It's important to note that while the G-Channel Trend Detection indicator can provide valuable insights into market trends, it should not be relied upon as a sole decision-making tool. As with any technical indicator, it is subject to limitations and should be used in combination with other analysis methods, risk management techniques, and sound trading principles.
오픈 소스 스크립트
트레이딩뷰의 진정한 정신에 따라, 이 스크립트의 작성자는 이를 오픈소스로 공개하여 트레이더들이 기능을 검토하고 검증할 수 있도록 했습니다. 작성자에게 찬사를 보냅니다! 이 코드는 무료로 사용할 수 있지만, 코드를 재게시하는 경우 하우스 룰이 적용된다는 점을 기억하세요.
✅💰⚡ Become part of the community get early get access here:
daviddtech.com
🔥Telegram Group:
t.me/DaviddTech
⚡ Videos & Tutorials :
youtube.com/channel/UC7NJLsf6IonOy8QI8gt5BeA?sub_confirmation=1
♥ @DaviddTech
daviddtech.com
🔥Telegram Group:
t.me/DaviddTech
⚡ Videos & Tutorials :
youtube.com/channel/UC7NJLsf6IonOy8QI8gt5BeA?sub_confirmation=1
♥ @DaviddTech
면책사항
해당 정보와 게시물은 금융, 투자, 트레이딩 또는 기타 유형의 조언이나 권장 사항으로 간주되지 않으며, 트레이딩뷰에서 제공하거나 보증하는 것이 아닙니다. 자세한 내용은 이용 약관을 참조하세요.