PROTECTED SOURCE SCRIPT
Dynamic Buy/Sell Volume Visualizer [wjdtks255]
Indicator Description:
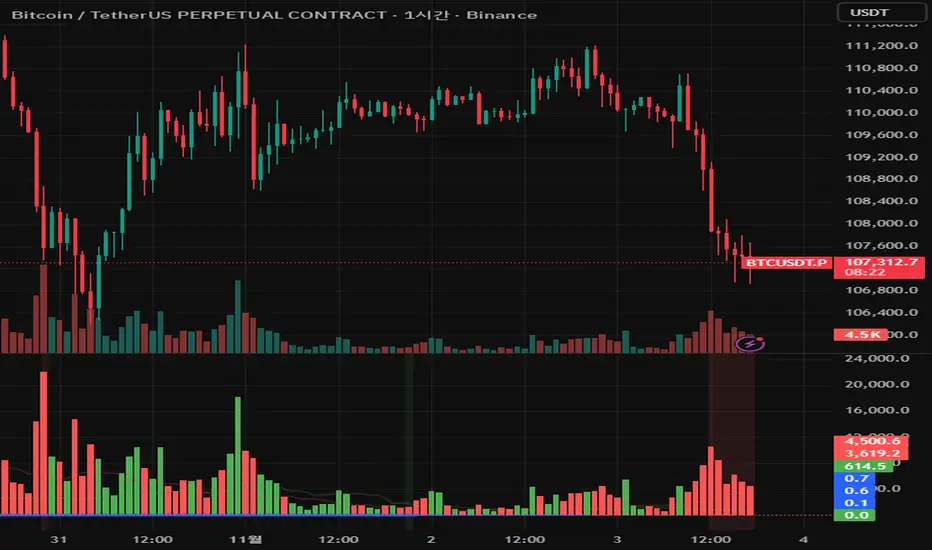
The Dynamic Buy/Sell Volume Visualizer separates bullish and bearish volumes and calculates their moving averages with customizable colors and transparency. It dynamically visualizes buying strength relative to selling pressure by plotting a volume ratio line that changes color intensity and line thickness based on volume dominance. Background colors highlight strong buying or selling phases when volumes exceed thresholds. Volume bars and moving averages provide clear market volume context, and horizontal lines mark key neutral and strength levels.
How It Works:
Bull and bear volumes are distinguished by candle direction.
Moving averages (SMA) smooth volume data with user-defined length and customizable visual styles.
The volume ratio (buy volume MA over total MA) reflects buying strength from 0 (full sell) to 1 (full buy).
The volume ratio line’s color and thickness change dynamically according to the ratio’s magnitude.
Background colors alert users when buy or sell volumes surpass thresholds.
Volume bars and moving averages give detailed volume insights, complemented by horizontal lines showing neutral (0.5), strong buy (0.7), and strong sell (0.3) levels.
Trading Method:
Use the volume ratio line to gauge current market pressure; above 0.7 suggests strong buying, below 0.3 indicates strong selling.
Observe background color shifts as quick visual cues for volume surges or declines.
Combine this volume visualization with price actions to time entries and exits.
Customize moving average parameters to align the indicator with your trading style.
보호된 스크립트입니다
이 스크립트는 비공개 소스로 게시됩니다. 하지만 제한 없이 자유롭게 사용할 수 있습니다 — 여기에서 자세히 알아보기.
면책사항
이 정보와 게시물은 TradingView에서 제공하거나 보증하는 금융, 투자, 거래 또는 기타 유형의 조언이나 권고 사항을 의미하거나 구성하지 않습니다. 자세한 내용은 이용 약관을 참고하세요.
면책사항
이 정보와 게시물은 TradingView에서 제공하거나 보증하는 금융, 투자, 거래 또는 기타 유형의 조언이나 권고 사항을 의미하거나 구성하지 않습니다. 자세한 내용은 이용 약관을 참고하세요.