OPEN-SOURCE SCRIPT
SMA, 20%UP, 20% SMA, LTH new
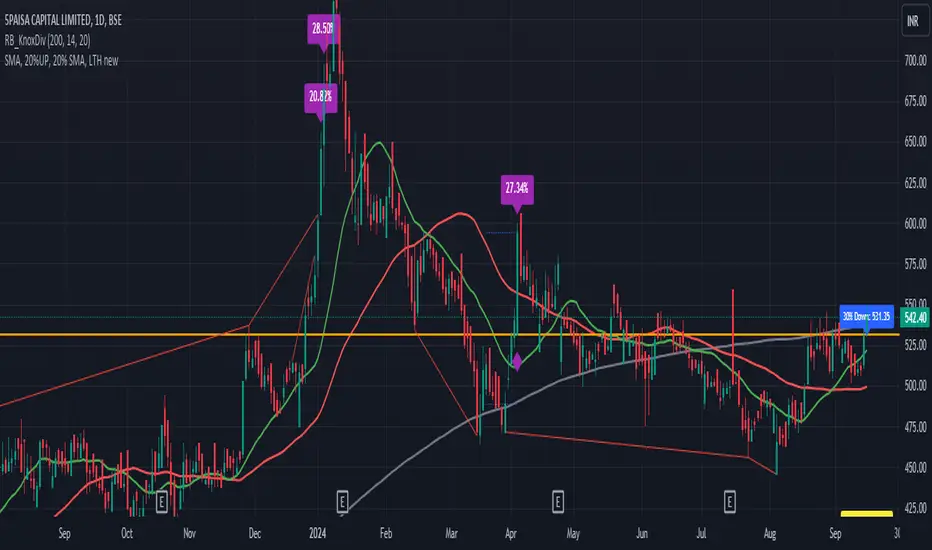
Features:
Simple Moving Averages (SMAs):
200 SMA (Gray): Long-term trend indicator. A widely used benchmark in many trading strategies.
50 SMA (Red): Mid-term trend indicator.
20 SMA (Green): Short-term trend indicator. These three SMAs allow traders to visualize the general market trend over different time horizons.
20% Gain on Green Candles:
This feature tracks continuous green candles and calculates the percentage gain from the lowest low to the highest high in that series.
If the gain is greater than or equal to 20%, the script highlights it with a purple triangle above the candle.
If the series of green candles starts with a candle where the low is below the 200 SMA, a purple diamond appears under the bar, indicating potential strong buying signals.
Lifetime High (LTH):
The script automatically tracks and displays the Lifetime High (LTH), i.e., the highest price ever recorded on the chart.
This level is important for identifying potential resistance areas and monitoring long-term market tops.
Once a new LTH is reached, it is displayed as a green line across the chart.
Support Levels from LTH:
The script calculates 30%, 50%, and 67% down from the LTH, marking key support levels.
These levels are plotted on the chart as orange lines and labeled to assist in spotting potential buy zones or market reversals.
52-Week Low:
It also calculates and displays the 52-week low for quick reference, plotted as a green line.
This helps traders assess major market bottoms and potential areas of support.
오픈 소스 스크립트
트레이딩뷰의 진정한 정신에 따라, 이 스크립트의 작성자는 이를 오픈소스로 공개하여 트레이더들이 기능을 검토하고 검증할 수 있도록 했습니다. 작성자에게 찬사를 보냅니다! 이 코드는 무료로 사용할 수 있지만, 코드를 재게시하는 경우 하우스 룰이 적용된다는 점을 기억하세요.
면책사항
해당 정보와 게시물은 금융, 투자, 트레이딩 또는 기타 유형의 조언이나 권장 사항으로 간주되지 않으며, 트레이딩뷰에서 제공하거나 보증하는 것이 아닙니다. 자세한 내용은 이용 약관을 참조하세요.
오픈 소스 스크립트
트레이딩뷰의 진정한 정신에 따라, 이 스크립트의 작성자는 이를 오픈소스로 공개하여 트레이더들이 기능을 검토하고 검증할 수 있도록 했습니다. 작성자에게 찬사를 보냅니다! 이 코드는 무료로 사용할 수 있지만, 코드를 재게시하는 경우 하우스 룰이 적용된다는 점을 기억하세요.
면책사항
해당 정보와 게시물은 금융, 투자, 트레이딩 또는 기타 유형의 조언이나 권장 사항으로 간주되지 않으며, 트레이딩뷰에서 제공하거나 보증하는 것이 아닙니다. 자세한 내용은 이용 약관을 참조하세요.