OPEN-SOURCE SCRIPT
업데이트됨 NYSE extended session background
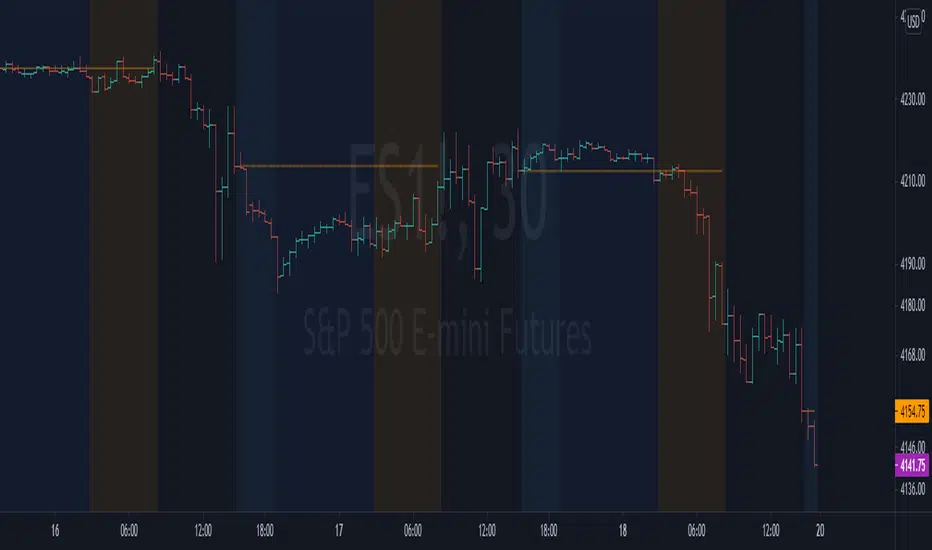
This script adds background to the chart to highlight different time areas in any chart.
The time areas are in relation to the open/close time of NYSE , both regular and extended session.
The background colors are the following by default:
In addition, previous day close price line is shown during extended and closed sessions (orange line).
This script is useful to visualize any chart in relation to the NYSE timetable.
The time areas are in relation to the open/close time of NYSE , both regular and extended session.
The background colors are the following by default:
- NO COLOR : NYSE is open
- DARK BLUE : NYSE is closed
- LIGHT BLUE : NYSE post market session
- ORANGE : NYSE pre market session
In addition, previous day close price line is shown during extended and closed sessions (orange line).
This script is useful to visualize any chart in relation to the NYSE timetable.
릴리즈 노트
bug that caused wrong background timing릴리즈 노트
Chart update오픈 소스 스크립트
트레이딩뷰의 진정한 정신에 따라, 이 스크립트의 작성자는 이를 오픈소스로 공개하여 트레이더들이 기능을 검토하고 검증할 수 있도록 했습니다. 작성자에게 찬사를 보냅니다! 이 코드는 무료로 사용할 수 있지만, 코드를 재게시하는 경우 하우스 룰이 적용된다는 점을 기억하세요.
면책사항
해당 정보와 게시물은 금융, 투자, 트레이딩 또는 기타 유형의 조언이나 권장 사항으로 간주되지 않으며, 트레이딩뷰에서 제공하거나 보증하는 것이 아닙니다. 자세한 내용은 이용 약관을 참조하세요.
오픈 소스 스크립트
트레이딩뷰의 진정한 정신에 따라, 이 스크립트의 작성자는 이를 오픈소스로 공개하여 트레이더들이 기능을 검토하고 검증할 수 있도록 했습니다. 작성자에게 찬사를 보냅니다! 이 코드는 무료로 사용할 수 있지만, 코드를 재게시하는 경우 하우스 룰이 적용된다는 점을 기억하세요.
면책사항
해당 정보와 게시물은 금융, 투자, 트레이딩 또는 기타 유형의 조언이나 권장 사항으로 간주되지 않으며, 트레이딩뷰에서 제공하거나 보증하는 것이 아닙니다. 자세한 내용은 이용 약관을 참조하세요.