OPEN-SOURCE SCRIPT
업데이트됨 Fractal Corridors
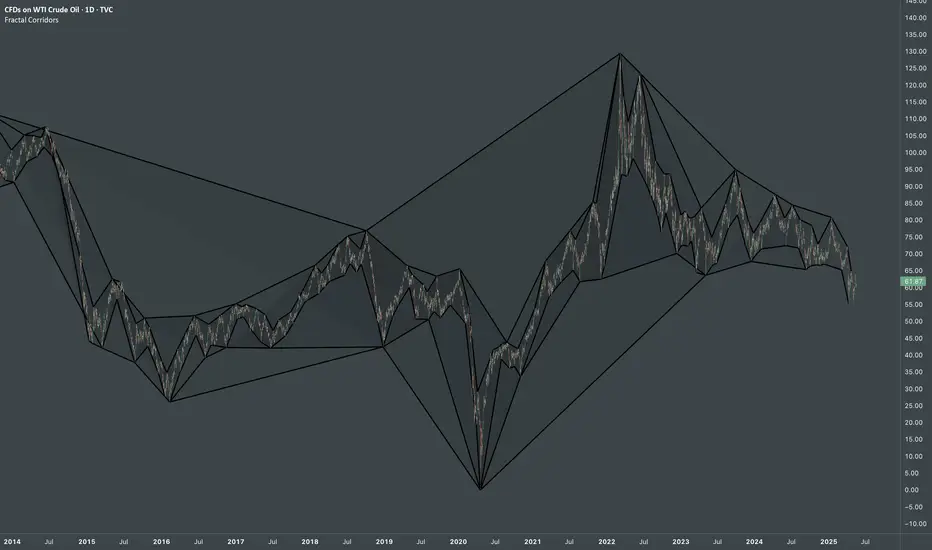
Fractal Corridors - visual tool that maps market structure through a multi-scale lens, revealing the underlying architecture of price action across time. By processing pivot points at multiple depths, it constructs a layered geometric corridors that reflects the self-similar, scalable nature of financial markets. Each pivot scale connects successive highs and lows with lines, and when both sides are present, fills the space between them, forming polygonal bands that shift in shape and density as volatility and trend evolve.
Inputs
The real value of this indicator lies not in generating executive signals, but in offering a structural perspective that blends short-term fluctuations with longer-term market cycles. The output allows to visually assess trends in terms of shapes, detect compression zones, and identify multi-timeframe confluence areas where price is likely to react. Whether used for macro trend confirmation or pattern evaluation, this indicator transforms raw price data into a clear, fractal-informed map of market behavior, helping the user navigate the complexity of emerging price through the language of geometry.
Inputs
- Base Depth: Number of bars for the smallest pivot
- Factor: Multiplier between small, medium and large depths
- Selectable color of components
The real value of this indicator lies not in generating executive signals, but in offering a structural perspective that blends short-term fluctuations with longer-term market cycles. The output allows to visually assess trends in terms of shapes, detect compression zones, and identify multi-timeframe confluence areas where price is likely to react. Whether used for macro trend confirmation or pattern evaluation, this indicator transforms raw price data into a clear, fractal-informed map of market behavior, helping the user navigate the complexity of emerging price through the language of geometry.
릴리즈 노트
Added "external" as alternative fill type that highlights the spacing between multi-scale highs or lows emphasizing external density exposure. This update places particular focus on exposing overall interconnectedness.As a unique visual indicator, this tool requires some explanation. It offers a scalable view of formative market structures that evolve with the trend, revealing how price behaves between phases of tight control and abrupt disorder. The visualization highlights the fractal nature of rhythmic intervals underlying market cadence, where smaller trend components echo the form of larger structures.
Rather than treating price as random noise, this indicator frames it as the emergent output of deeper, self-organizing processes, emphasizing the recursive logic embedded in market behavior.
오픈 소스 스크립트
트레이딩뷰의 진정한 정신에 따라, 이 스크립트의 작성자는 이를 오픈소스로 공개하여 트레이더들이 기능을 검토하고 검증할 수 있도록 했습니다. 작성자에게 찬사를 보냅니다! 이 코드는 무료로 사용할 수 있지만, 코드를 재게시하는 경우 하우스 룰이 적용된다는 점을 기억하세요.
Unlock exclusive tools: fractlab.com
ᴀʟʟ ᴄᴏɴᴛᴇɴᴛ ᴘʀᴏᴠɪᴅᴇᴅ ʙʏ ꜰʀᴀᴄᴛʟᴀʙ ɪꜱ ɪɴᴛᴇɴᴅᴇᴅ ꜰᴏʀ ɪɴꜰᴏʀᴍᴀᴛɪᴏɴᴀʟ ᴀɴᴅ ᴇᴅᴜᴄᴀᴛɪᴏɴᴀʟ ᴘᴜʀᴘᴏꜱᴇꜱ ᴏɴʟʏ.
ᴘᴀꜱᴛ ᴘᴇʀꜰᴏʀᴍᴀɴᴄᴇ ɪꜱ ɴᴏᴛ ɪɴᴅɪᴄᴀᴛɪᴠᴇ ᴏꜰ ꜰᴜᴛᴜʀᴇ ʀᴇꜱᴜʟᴛꜱ.
ᴀʟʟ ᴄᴏɴᴛᴇɴᴛ ᴘʀᴏᴠɪᴅᴇᴅ ʙʏ ꜰʀᴀᴄᴛʟᴀʙ ɪꜱ ɪɴᴛᴇɴᴅᴇᴅ ꜰᴏʀ ɪɴꜰᴏʀᴍᴀᴛɪᴏɴᴀʟ ᴀɴᴅ ᴇᴅᴜᴄᴀᴛɪᴏɴᴀʟ ᴘᴜʀᴘᴏꜱᴇꜱ ᴏɴʟʏ.
ᴘᴀꜱᴛ ᴘᴇʀꜰᴏʀᴍᴀɴᴄᴇ ɪꜱ ɴᴏᴛ ɪɴᴅɪᴄᴀᴛɪᴠᴇ ᴏꜰ ꜰᴜᴛᴜʀᴇ ʀᴇꜱᴜʟᴛꜱ.
면책사항
해당 정보와 게시물은 금융, 투자, 트레이딩 또는 기타 유형의 조언이나 권장 사항으로 간주되지 않으며, 트레이딩뷰에서 제공하거나 보증하는 것이 아닙니다. 자세한 내용은 이용 약관을 참조하세요.