OPEN-SOURCE SCRIPT
LargestMarketCaps
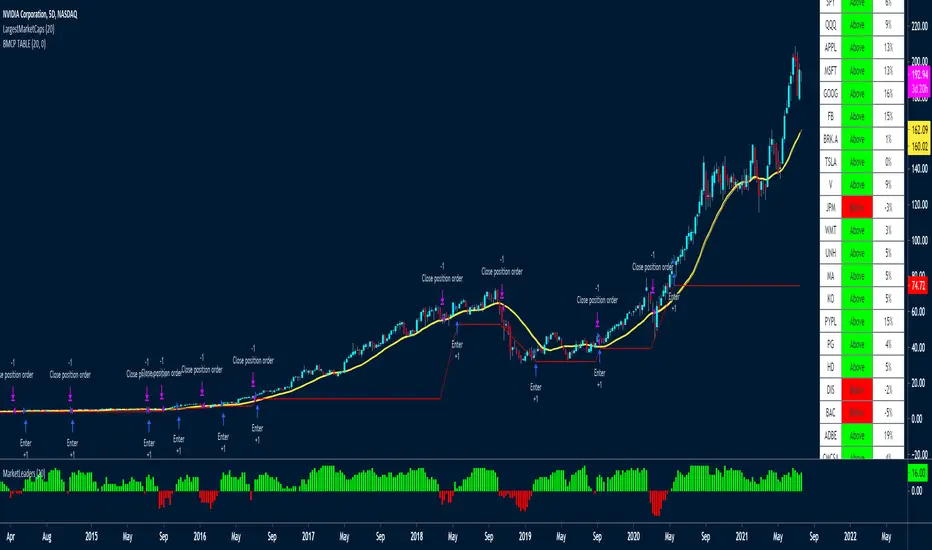
This trading system uses a MA to check if the LARGEST CAP stocks are above or below the MA.
You can see from the indicator below how well it manages to capture big moves.
These are the tickers that the strategy and indicator currently looks at
The tickers will need to be updated every 6-12 months to remove and ad those who have dropped out of the largest 20 stocks.
It would be a good idea to create a watchlist and alerts for the Large Cap tickers so you can scroll through to see how the system performed on each ticker
"SPX"
"QQQ"
"AAPL"
"MSFT"
"GOOG"
"FB"
"BRK.A"
"TSLA"
"V"
"JPM"
"WMT"
"UNH"
"MA"
"KO"
"PYPL"
"PG"
"HD"
"DIS"
"BAC"
"ADBE"
"CMCSA"
"NKE"
RELATED IDEAS / Indicators
* Market Leaders Ribbon

* Market Leaders Large Performance Table

You can see from the indicator below how well it manages to capture big moves.
- It aggregates the data of all the tickers to create the histogram indicator at the bottom of the chart called MarketLeaders.
- If a ticker is above its moving average, then the output will increase by +1 and -1 if a ticker is below its moving average.
- This is a powerful system because it uses not only data from one stock but from the stocks that really affect the market big time. If those stocks don't do well, the market won't do well either.
- Basically if all the market leaders are doing well, then this system will buy those 20 tickers and keep positions open until the MarketLeaders indicator crosses below 0 -- meaning red.
- It also has a red stop loss line, with a wide 15% stop loss to keep us in the trades for the long term.
- I've used a 5-day chart because I wanted fewer signals, but higher quality signals.
- There are no profit targets, this exits when the indicator turns red -- meaning below 0 or if a position falls 15% in price.
- The MA setting is adjustable, the default is 20
These are the tickers that the strategy and indicator currently looks at
The tickers will need to be updated every 6-12 months to remove and ad those who have dropped out of the largest 20 stocks.
It would be a good idea to create a watchlist and alerts for the Large Cap tickers so you can scroll through to see how the system performed on each ticker
"SPX"
"QQQ"
"AAPL"
"MSFT"
"GOOG"
"FB"
"BRK.A"
"TSLA"
"V"
"JPM"
"WMT"
"UNH"
"MA"
"KO"
"PYPL"
"PG"
"HD"
"DIS"
"BAC"
"ADBE"
"CMCSA"
"NKE"
RELATED IDEAS / Indicators
* Market Leaders Ribbon
* Market Leaders Large Performance Table
오픈 소스 스크립트
트레이딩뷰의 진정한 정신에 따라, 이 스크립트의 작성자는 이를 오픈소스로 공개하여 트레이더들이 기능을 검토하고 검증할 수 있도록 했습니다. 작성자에게 찬사를 보냅니다! 이 코드는 무료로 사용할 수 있지만, 코드를 재게시하는 경우 하우스 룰이 적용된다는 점을 기억하세요.
면책사항
해당 정보와 게시물은 금융, 투자, 트레이딩 또는 기타 유형의 조언이나 권장 사항으로 간주되지 않으며, 트레이딩뷰에서 제공하거나 보증하는 것이 아닙니다. 자세한 내용은 이용 약관을 참조하세요.
오픈 소스 스크립트
트레이딩뷰의 진정한 정신에 따라, 이 스크립트의 작성자는 이를 오픈소스로 공개하여 트레이더들이 기능을 검토하고 검증할 수 있도록 했습니다. 작성자에게 찬사를 보냅니다! 이 코드는 무료로 사용할 수 있지만, 코드를 재게시하는 경우 하우스 룰이 적용된다는 점을 기억하세요.
면책사항
해당 정보와 게시물은 금융, 투자, 트레이딩 또는 기타 유형의 조언이나 권장 사항으로 간주되지 않으며, 트레이딩뷰에서 제공하거나 보증하는 것이 아닙니다. 자세한 내용은 이용 약관을 참조하세요.