OPEN-SOURCE SCRIPT
업데이트됨 Smooth Cloud [BigBeluga]
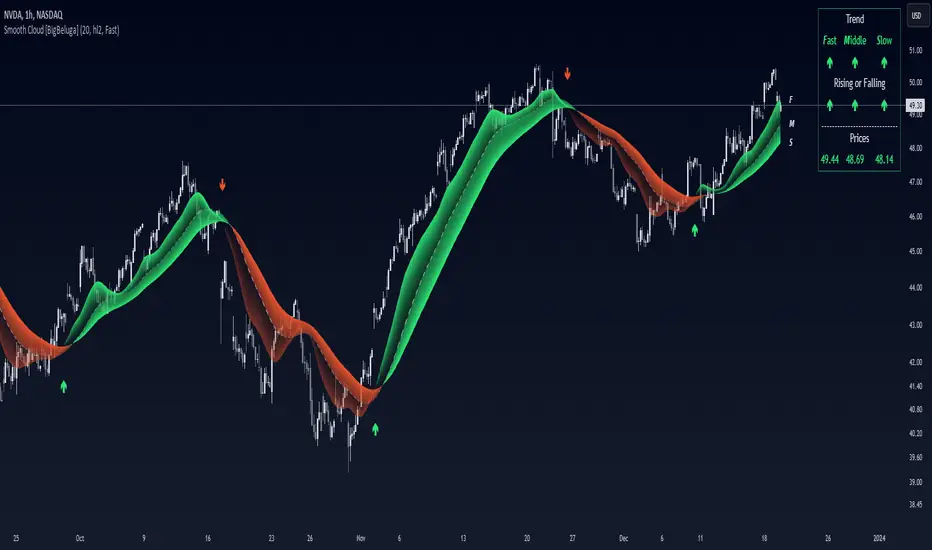
This trend-following indicator, called Smooth Cloud, is built on top of a SuperSmoother Filter of John Ehlers with small modification.
It consists of three smoothed lines—Fast, Middle, and Slow—that together form a cloud. These lines are based on different periods, helping traders analyze market changes over different timeframes (fast, mid, and slow). The indicator offers a color-coded visual cloud to depict trend direction, along with a detailed dashboard that shows the positioning of the lines, whether they are rising or falling, and their price levels.
🔵 IDEA
The Smooth Cloud indicator is designed to help traders quickly assess the market trend by using three smoothed lines with varying periods. The lines represent fast, mid, and slow market changes, and their relative positioning provides a clear view of trend shifts. The dashboard gives a more granular view by showing if the lines are rising or falling individually, without comparing them to each other, providing insights into potential trend changes before they are fully formed. The color-coded cloud further enhances the visual experience by allowing traders to see trend direction at a glance, making it easier to spot major and minor shifts in the market.

🔵 KEY FEATURES & USAGE
◉ Three Smoothed Lines (Fast, Mid, Slow):
The indicator consists of three smoothed lines, each representing a different periods. The Fast line reacts more quickly to price changes, while the Slow line reacts more slowly, allowing traders to capture both short-term and long-term trend information. The lines are based on different lengths, and their positioning relative to each other helps determine market direction.

◉ Color-Coded Cloud:
The cloud formed between the lines is color-coded to indicate trend direction. When the Fast line is above the Slow line, it signals an upward trend, and the cloud is green. When the Fast line is below the Slow line, the cloud turns red, indicating a downward trend. This color coding makes it easy to spot the overall trend direction visually without having to analyze the lines in detail.

◉ Dashboard for Line Positioning and Trend Direction:
A dashboard in the top right corner of the chart shows the positioning of the Fast, Middle, and Slow lines relative to each other. It displays arrows for each line to indicate whether the line is above or below the other lines. For exae determines its trend direction based on its position to mid line — if it's above, an upward arrow is displayed, and if it's below mid line, a downward arrow is shown.mple, if the Fast line is above the Slow line, the dashboard shows an upward arrow for the Fast line. The Slow lin
Up trend:

Up trend shift:

Down trend shift:

Down Trend:

◉ Rising and Falling Detection:
The dashboard also tracks whether the lines are rising or falling based solely on their own values. If a line rises or falls consistently over three bars, the dashboard shows an upward or downward arrow under the "Rising or Falling" section. This feature provides additional insight into the market's momentum, allowing traders to spot potential trend reversals more quickly.


◉ Price Levels for Fast, Middle, and Slow Lines:
The dashboard includes the price levels for the Fast, Middle, and Slow lines, displayed at the bottom. These levels give traders a quick reference for where the lines are currently positioned relative to the price, adding further context to the trend information displayed.

◉ Fast Signals:
The fast signals are diplayed when fast line crosses slow line. Gree arrows up shows fast line crossed over slow and when arrow down fast line crossed under slow one.

🔵 CUSTOMIZATION
Related script:
![Ultimate Bands [BigBeluga]](https://s3.tradingview.com/v/vee2rn21_mid.png)
It consists of three smoothed lines—Fast, Middle, and Slow—that together form a cloud. These lines are based on different periods, helping traders analyze market changes over different timeframes (fast, mid, and slow). The indicator offers a color-coded visual cloud to depict trend direction, along with a detailed dashboard that shows the positioning of the lines, whether they are rising or falling, and their price levels.
🔵 IDEA
The Smooth Cloud indicator is designed to help traders quickly assess the market trend by using three smoothed lines with varying periods. The lines represent fast, mid, and slow market changes, and their relative positioning provides a clear view of trend shifts. The dashboard gives a more granular view by showing if the lines are rising or falling individually, without comparing them to each other, providing insights into potential trend changes before they are fully formed. The color-coded cloud further enhances the visual experience by allowing traders to see trend direction at a glance, making it easier to spot major and minor shifts in the market.
🔵 KEY FEATURES & USAGE
◉ Three Smoothed Lines (Fast, Mid, Slow):
The indicator consists of three smoothed lines, each representing a different periods. The Fast line reacts more quickly to price changes, while the Slow line reacts more slowly, allowing traders to capture both short-term and long-term trend information. The lines are based on different lengths, and their positioning relative to each other helps determine market direction.
◉ Color-Coded Cloud:
The cloud formed between the lines is color-coded to indicate trend direction. When the Fast line is above the Slow line, it signals an upward trend, and the cloud is green. When the Fast line is below the Slow line, the cloud turns red, indicating a downward trend. This color coding makes it easy to spot the overall trend direction visually without having to analyze the lines in detail.
◉ Dashboard for Line Positioning and Trend Direction:
A dashboard in the top right corner of the chart shows the positioning of the Fast, Middle, and Slow lines relative to each other. It displays arrows for each line to indicate whether the line is above or below the other lines. For exae determines its trend direction based on its position to mid line — if it's above, an upward arrow is displayed, and if it's below mid line, a downward arrow is shown.mple, if the Fast line is above the Slow line, the dashboard shows an upward arrow for the Fast line. The Slow lin
Up trend:
Up trend shift:
Down trend shift:
Down Trend:
◉ Rising and Falling Detection:
The dashboard also tracks whether the lines are rising or falling based solely on their own values. If a line rises or falls consistently over three bars, the dashboard shows an upward or downward arrow under the "Rising or Falling" section. This feature provides additional insight into the market's momentum, allowing traders to spot potential trend reversals more quickly.
◉ Price Levels for Fast, Middle, and Slow Lines:
The dashboard includes the price levels for the Fast, Middle, and Slow lines, displayed at the bottom. These levels give traders a quick reference for where the lines are currently positioned relative to the price, adding further context to the trend information displayed.
◉ Fast Signals:
The fast signals are diplayed when fast line crosses slow line. Gree arrows up shows fast line crossed over slow and when arrow down fast line crossed under slow one.
🔵 CUSTOMIZATION
- Length Input: You can adjust the length parameter, which affects the smoothing period for the lines. A shorter length makes the lines react more quickly to price changes, while a longer length provides a smoother, more gradual response.
- Source Input: The indicator uses the hl2 source (the average of the high and low prices), but you can change this to another source to better suit your trading strategy.
- Signals Type: Select between "Fast" and "Slow". Fast signals - is interaction of fast and slow lines. Slow signals is interaction of mid and slow lines
Related script:
릴리즈 노트
-Color SettignsNow it is possible to change colors and make them transparent for cloud, separate from dashboard
오픈 소스 스크립트
트레이딩뷰의 진정한 정신에 따라, 이 스크립트의 작성자는 이를 오픈소스로 공개하여 트레이더들이 기능을 검토하고 검증할 수 있도록 했습니다. 작성자에게 찬사를 보냅니다! 이 코드는 무료로 사용할 수 있지만, 코드를 재게시하는 경우 하우스 룰이 적용된다는 점을 기억하세요.
🔵Gain access to our powerful tools : bigbeluga.com/tv
🔵Join our free discord for updates : bigbeluga.com/discord
All scripts & content provided by BigBeluga are for informational & educational purposes only.
🔵Join our free discord for updates : bigbeluga.com/discord
All scripts & content provided by BigBeluga are for informational & educational purposes only.
면책사항
해당 정보와 게시물은 금융, 투자, 트레이딩 또는 기타 유형의 조언이나 권장 사항으로 간주되지 않으며, 트레이딩뷰에서 제공하거나 보증하는 것이 아닙니다. 자세한 내용은 이용 약관을 참조하세요.