PROTECTED SOURCE SCRIPT
업데이트됨 [GYTS-CE] Signal Provider | WaveTrend 4D with GDM
WaveTrend 4D with Gradient Divergence Measure (Community Edition)
🌸 "📡 Signal Provider" in GoemonYae Trading System (GYTS) 🌸
WaveTrend 4D (WT4D) is an extension of the incredible WaveTrend 3D (2022, Justin Dehorty). This oscillator elevates the classic WaveTrend by integrating advanced mathematical models for a multi-dimensional view of market momentum, capturing subtle shifts and trends that traditional indicators might miss. Each oscillator layer uses a combination of normalised derivatives, hyperbolic tangent transformations, and dual-pole filtering (John Ehlers' SuperSmoother), providing normalised and smooth signals with minimised lag.
The name "WaveTrend 4D" is derived from the usage of 4 dimensions, representing different frequencies or timeframes. Next to the "fast", "normal" and "slow" frequency, the fourth frequency is called "lethargic" (very slow). This gives the opportunity utilise more dimensions without having abundant signals, since we quantify and filter the quality of signals.
WT4D strives to help discriminating high-quality signals from the indicator by introducing the Gradient Divergence Measure (GDM) and Quantile Median Crosses (QMC). For simplicity, speed and focus, this particular indicator includes only the GDM part. Check the other 🤲Community Edition of this indicator that focuses on the QMC. For GDM, see below for more information.
🌸 --- GRADIENT DIVERGENCE MEASURE (GDM) --- 🌸

💮 Introduction
--
The GDM dynamically calculates a composite measure based on multiple factors. Unlike traditional binary divergence indicators, GDM employs a continuous value system to capture the nuanced dynamics of market behaviour. This methodology allows traders and analysts to assess the potency of divergence signals with greater precision, facilitating more informed decision-making processes.
💮 Methodology
--
The GDM is calculated using a composite formula that integrates various market dynamics. At its core, it consists of six components listed below, each weighted to optimize the indicator's responsiveness to market conditions:
💮 Tuning the GDM
--
The 6 components discussed above are not independent, e.g. the slope is actually the result of the magnitude between waves, the absolute value and time duration. However, the default GDM is carefully tuned to include all these features without being too sensitive to outliers.
This makes this indicator very user-friendly. The only core parameter is the the "sensitivity". This controls the extent of normalisation between signals, and essentially affects how often strong GDMs appear. At the conservative end (higher sensitivity), the strong GDMs are less frequent but are relatively significant, while with a lower sensitivity the strong GDMs appear more frequent.
💮 GDM on the Oscillator
--
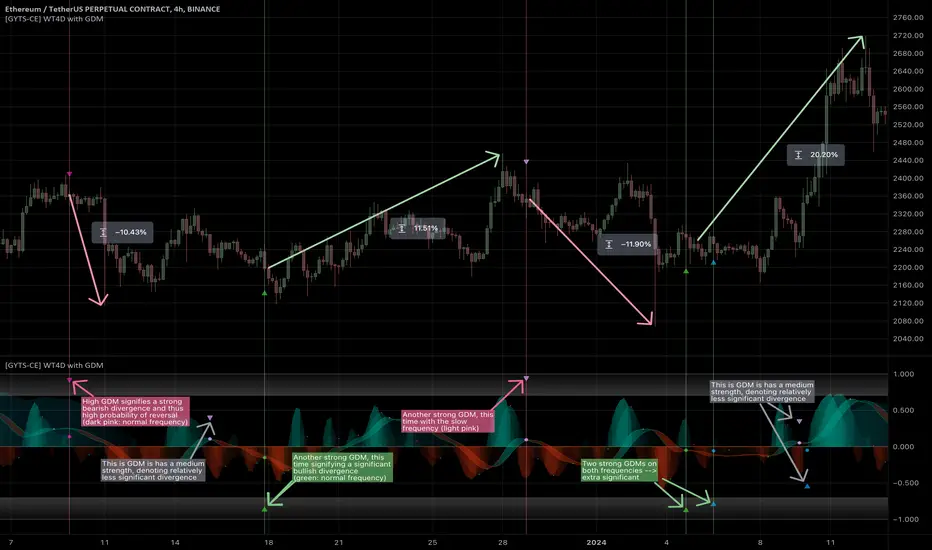
The GDMs are represented by triangles and their value represents the strength. A value close to `1` signifies a strong bearish divergence and thus a possible reversal of continuation of a downtrend. Similarly, a value close to `-1` signifies a strong bullish divergence.
Note that there are two colour sets which can be enabled and disabled. One uses crosses between the fast and normal frequencies (with the slow frequency acting as the price trend with which there should be an opposite interaction -- hence a "divergence"). Similarly, crosses between the normal and slow frequencies (with the lethargic (the most slow) frequency acting as the price trend) are used to find divergences on a higher timeframe.
Another handy feature is a threshold to more strikingly visualise "strong" GDMs.
🌸 --- GOEMONYAE TRADING SYSTEM --- 🌸
As previously mentioned, this indicator is a 📡 Signal Provider, part of the suite of the GoemonYae Trading System (🤲 Community Edition). The greatest value comes from connecting multiple 📡 Signal Providers to the 🧬 Flux Composer to find confluence between signals. Contrary to most other indicators that connect with each other, the signals that are passed are not just binary signals ("buy" or "sell") but pass the actual GDM and QMC values. This gives the opportunity in the 🧬 Flux Composer to more accurately use multiple signals with different strengths to finally give an overall signal. On its turn, the Flux Composer can be connected to the GYTS "🎼 Order Orchestrator" for backtesting and trade automation.
🌸 "📡 Signal Provider" in GoemonYae Trading System (GYTS) 🌸
WaveTrend 4D (WT4D) is an extension of the incredible WaveTrend 3D (2022, Justin Dehorty). This oscillator elevates the classic WaveTrend by integrating advanced mathematical models for a multi-dimensional view of market momentum, capturing subtle shifts and trends that traditional indicators might miss. Each oscillator layer uses a combination of normalised derivatives, hyperbolic tangent transformations, and dual-pole filtering (John Ehlers' SuperSmoother), providing normalised and smooth signals with minimised lag.
The name "WaveTrend 4D" is derived from the usage of 4 dimensions, representing different frequencies or timeframes. Next to the "fast", "normal" and "slow" frequency, the fourth frequency is called "lethargic" (very slow). This gives the opportunity utilise more dimensions without having abundant signals, since we quantify and filter the quality of signals.
WT4D strives to help discriminating high-quality signals from the indicator by introducing the Gradient Divergence Measure (GDM) and Quantile Median Crosses (QMC). For simplicity, speed and focus, this particular indicator includes only the GDM part. Check the other 🤲Community Edition of this indicator that focuses on the QMC. For GDM, see below for more information.
🌸 --- GRADIENT DIVERGENCE MEASURE (GDM) --- 🌸
💮 Introduction
--
The GDM dynamically calculates a composite measure based on multiple factors. Unlike traditional binary divergence indicators, GDM employs a continuous value system to capture the nuanced dynamics of market behaviour. This methodology allows traders and analysts to assess the potency of divergence signals with greater precision, facilitating more informed decision-making processes.
💮 Methodology
--
The GDM is calculated using a composite formula that integrates various market dynamics. At its core, it consists of six components listed below, each weighted to optimize the indicator's responsiveness to market conditions:
- The magnitude of relative change between waves -- A larger difference between the waves, i.e. lower high or higher low could signify a stronger divergence.
- The absolute value of the latest wave -- The strength of the latest wave provides insight into the extremity of the market conditions.
- Slope of the divergence -- The slope between the two points of divergence essentially measures the rate of change in the frequency\'s value over time. It captures both the direction and the steepness of the indicator’s move between two waves.
- The magnitude of relative change of the price -- A divergence means that the oscillator shows an opposite pattern than price action. Thus, if the price makes a significantly higher high or lower low, but the indicator does not, this discrepancy can be used to measure the divergence strength. This components measures the price's extrema during the crosses of the indicator's waves.
- Higher timeframe's frequency trend -- Similarly, instead of looking at the price directly, this component measures the more general trend of the price by using the higher timeframe frequency (i.e. the slow frequency when looking at divergences of the normal frequency).
- Time duration -- Lastly, the time duration between the two points of a divergence can also be an important factor. A divergence that spans over a longer period might indicate a more significant market sentiment shift.
💮 Tuning the GDM
--
The 6 components discussed above are not independent, e.g. the slope is actually the result of the magnitude between waves, the absolute value and time duration. However, the default GDM is carefully tuned to include all these features without being too sensitive to outliers.
This makes this indicator very user-friendly. The only core parameter is the the "sensitivity". This controls the extent of normalisation between signals, and essentially affects how often strong GDMs appear. At the conservative end (higher sensitivity), the strong GDMs are less frequent but are relatively significant, while with a lower sensitivity the strong GDMs appear more frequent.
💮 GDM on the Oscillator
--
The GDMs are represented by triangles and their value represents the strength. A value close to `1` signifies a strong bearish divergence and thus a possible reversal of continuation of a downtrend. Similarly, a value close to `-1` signifies a strong bullish divergence.
Note that there are two colour sets which can be enabled and disabled. One uses crosses between the fast and normal frequencies (with the slow frequency acting as the price trend with which there should be an opposite interaction -- hence a "divergence"). Similarly, crosses between the normal and slow frequencies (with the lethargic (the most slow) frequency acting as the price trend) are used to find divergences on a higher timeframe.
Another handy feature is a threshold to more strikingly visualise "strong" GDMs.
🌸 --- GOEMONYAE TRADING SYSTEM --- 🌸
As previously mentioned, this indicator is a 📡 Signal Provider, part of the suite of the GoemonYae Trading System (🤲 Community Edition). The greatest value comes from connecting multiple 📡 Signal Providers to the 🧬 Flux Composer to find confluence between signals. Contrary to most other indicators that connect with each other, the signals that are passed are not just binary signals ("buy" or "sell") but pass the actual GDM and QMC values. This gives the opportunity in the 🧬 Flux Composer to more accurately use multiple signals with different strengths to finally give an overall signal. On its turn, the Flux Composer can be connected to the GYTS "🎼 Order Orchestrator" for backtesting and trade automation.
릴리즈 노트
- Upgrade to Pine Script v6
- More usage of GYTS libraries
보호된 스크립트입니다
이 스크립트는 비공개 소스로 게시됩니다. 하지만 이를 자유롭게 제한 없이 사용할 수 있습니다 – 자세한 내용은 여기에서 확인하세요.
🌸 --- GoemonYae Trading System (GYTS) --- 🌸
・ Website: goemonyae.com
・ Documentation: goemonyae.com/docs
・ Discord server (incl. 🦊YaeBot): discord.gg/ef6Tu4kha3
・ personal LinkedIn: linkedin.com/in/arthur-nazarian
・ Website: goemonyae.com
・ Documentation: goemonyae.com/docs
・ Discord server (incl. 🦊YaeBot): discord.gg/ef6Tu4kha3
・ personal LinkedIn: linkedin.com/in/arthur-nazarian
면책사항
해당 정보와 게시물은 금융, 투자, 트레이딩 또는 기타 유형의 조언이나 권장 사항으로 간주되지 않으며, 트레이딩뷰에서 제공하거나 보증하는 것이 아닙니다. 자세한 내용은 이용 약관을 참조하세요.