OPEN-SOURCE SCRIPT
업데이트됨 Hi-Lo Trend
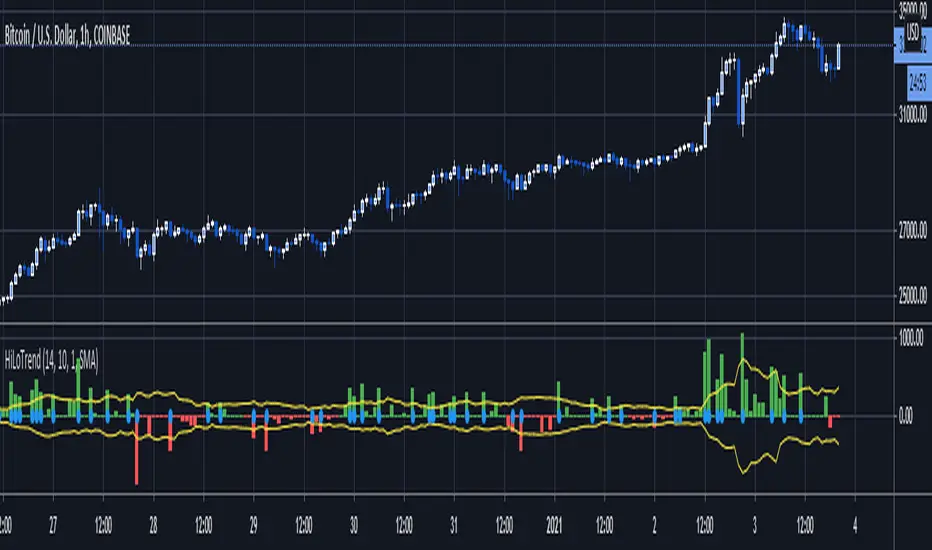
This script uses the most recent low/high and candle size to determine trend breakouts.
The trend is determined buy whether the most recent price extreme within the Lookback period is a high or low. If it is a most recent high, it is an uptrend, if it is a lwo, a downtrend.
Bands are created using the average absolute difference of current minus previous close over the MABandPeriod, multiplied by the MABandMultiplier.
If the current close minus previous close is above/below the band, then a blue dot is painted and it is a breakout.
a buy alert fires when a downtrend becomes an uptrend and a breakout above the bands happens.
A sell alert fires when an uptrend becomes a downtrend and a breakout below the bands happns.
릴리즈 노트
added some comments : )오픈 소스 스크립트
트레이딩뷰의 진정한 정신에 따라, 이 스크립트의 작성자는 이를 오픈소스로 공개하여 트레이더들이 기능을 검토하고 검증할 수 있도록 했습니다. 작성자에게 찬사를 보냅니다! 이 코드는 무료로 사용할 수 있지만, 코드를 재게시하는 경우 하우스 룰이 적용된다는 점을 기억하세요.
Software Engineer and FX, Options, Crypto Trader. Previously worked at large options market maker. If you like my scripts and would like to donate:
Bitcoin: 179ETrGo3FCVcnBV8i1uc4J8YHFRknYytz
Eth: 0x73d59A8214FD70053aF37E9700692e25de441245
Bitcoin: 179ETrGo3FCVcnBV8i1uc4J8YHFRknYytz
Eth: 0x73d59A8214FD70053aF37E9700692e25de441245
면책사항
해당 정보와 게시물은 금융, 투자, 트레이딩 또는 기타 유형의 조언이나 권장 사항으로 간주되지 않으며, 트레이딩뷰에서 제공하거나 보증하는 것이 아닙니다. 자세한 내용은 이용 약관을 참조하세요.
오픈 소스 스크립트
트레이딩뷰의 진정한 정신에 따라, 이 스크립트의 작성자는 이를 오픈소스로 공개하여 트레이더들이 기능을 검토하고 검증할 수 있도록 했습니다. 작성자에게 찬사를 보냅니다! 이 코드는 무료로 사용할 수 있지만, 코드를 재게시하는 경우 하우스 룰이 적용된다는 점을 기억하세요.
Software Engineer and FX, Options, Crypto Trader. Previously worked at large options market maker. If you like my scripts and would like to donate:
Bitcoin: 179ETrGo3FCVcnBV8i1uc4J8YHFRknYytz
Eth: 0x73d59A8214FD70053aF37E9700692e25de441245
Bitcoin: 179ETrGo3FCVcnBV8i1uc4J8YHFRknYytz
Eth: 0x73d59A8214FD70053aF37E9700692e25de441245
면책사항
해당 정보와 게시물은 금융, 투자, 트레이딩 또는 기타 유형의 조언이나 권장 사항으로 간주되지 않으며, 트레이딩뷰에서 제공하거나 보증하는 것이 아닙니다. 자세한 내용은 이용 약관을 참조하세요.