INVITE-ONLY SCRIPT
VWAP by YSTC
This is a PAID Indicator from Volume Profile and VWAP Pack.
According to payment you will either get a TradingView account with indicators activated or
Have to send an email to contact@ystc.in with the email you used to sign up with us, and with your TradingView Username.
The script is available (for free) to YSTC's Course members of "Trading with PAV".
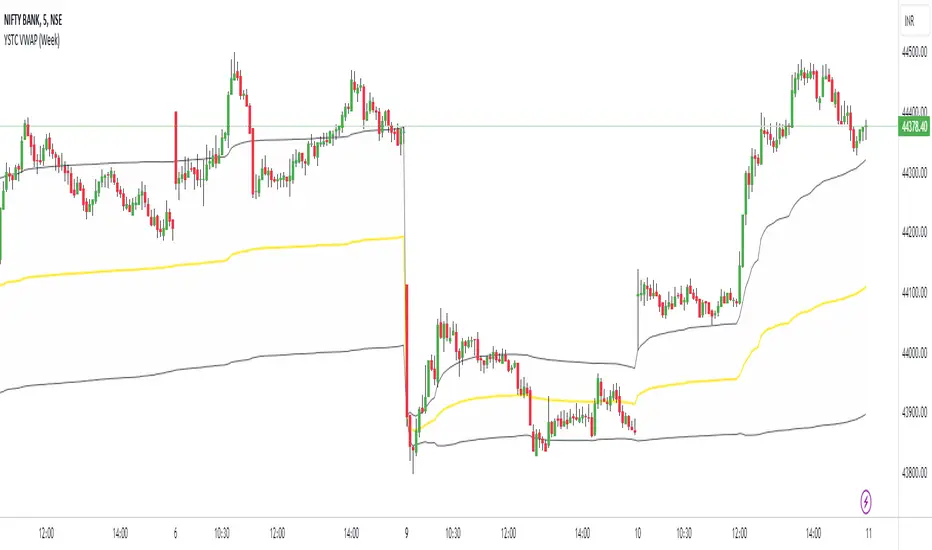
VWAP stands for Volume Weighted Average Price. It is a trading indicator that shows where the "fair value" of the instrument is. It is calculated using PRICE and VOLUMES.
VWAP by YSTC shows: VWAP , 1st Deviation, 2nd Deviation and 3rd Deviations.
This VWAP also has Futures volume shown for Index.
You can easily switch between these VWAP calculations:
Daily (ideal for intraday trading)
Weekly (ideal for intraday trading)
Monthly (ideal for long-term/swing trading)
Yearly (ideal for long-term/swing trading)
How does VWAP work?
WVAP is a simple line that shows on a price chart. It shows where the "fair value" of the trading instrument is.
If the price is above this line, then the instrument is overpriced and its price should drop back to the VWAP line.
If the price is below the line, then it is undervalued and it should move upwards back to the VWAP line.

How is VWAP different from EMA , SMA , and other standard Average indicators?
Standard indicators that show the average price ( EMA , SMA , ...) are calculated using two variables: PRICE and TIME.
VWAP brings VOLUME into the equation. It is calculated using three variables: PRICE, TIME and VOLUMES.
This is realty important, because VOLUMES make all the difference!
How to use VWAP in trading?
There are more ways how to trade using the VWAP. The simplest way comes from the logic, that the VWAP represents a "fair value" and that the price should always return to it.
Many trading algorithms work like this: they BUY when the price is BELOW VWAP , and they SELL when the price is ABOVE VWAP .
You can image VWAP (yellow line) as a magnet.

VWAP deviations
The VWAP indicator which I developed has also the option to calculate 1st and 2nd VWAP deviations. Those are standard deviations calculated from the VWAP and they are really useful. In fact, most of my VWAP trading strategies are based on deviations.
Use VWAP deviations to identify TREND and ROTATION
When the Deviations move sideways (horizontally), then there is a ROTATION:

When the Deviations move upwards or downwards (vertically), then there is a TREND:

Sometimes, you can tell whether there is ROTATION or a TREND by just looking at the simple price chart. But there are cases when it is not so clear.
A healthy trend needs to be volume driven. There needs to be big money behind the move (the big guys need to join the party). VWAP and its Deviations reflect that because they track VOLUMES.
That's why they are so good at revealing trends!
In my trading, I like to use the Deviations as Supports and Resistances. The price has nice reactions to them. Especially to the 1st and 2nd Deviation, which I like to use the most in my trading strategies.
A good place for a Take Profit is the yellow VWAP line. The reason is that it works as a magnet - the price tends to return to it.
You can add this script to your chart by clicking "Add to favorite indicators" below.
Have Questions ?
contact@ystc.in
Free Stock Market Introduction Available.
Name: Yogesh Patil (YS Trading Coach).
Contact: +91 9637070868.
Time: Monday to Friday (10:00 AM - 07:00 PM).
According to payment you will either get a TradingView account with indicators activated or
Have to send an email to contact@ystc.in with the email you used to sign up with us, and with your TradingView Username.
The script is available (for free) to YSTC's Course members of "Trading with PAV".
VWAP stands for Volume Weighted Average Price. It is a trading indicator that shows where the "fair value" of the instrument is. It is calculated using PRICE and VOLUMES.
VWAP by YSTC shows: VWAP , 1st Deviation, 2nd Deviation and 3rd Deviations.
This VWAP also has Futures volume shown for Index.
You can easily switch between these VWAP calculations:
Daily (ideal for intraday trading)
Weekly (ideal for intraday trading)
Monthly (ideal for long-term/swing trading)
Yearly (ideal for long-term/swing trading)
How does VWAP work?
WVAP is a simple line that shows on a price chart. It shows where the "fair value" of the trading instrument is.
If the price is above this line, then the instrument is overpriced and its price should drop back to the VWAP line.
If the price is below the line, then it is undervalued and it should move upwards back to the VWAP line.
How is VWAP different from EMA , SMA , and other standard Average indicators?
Standard indicators that show the average price ( EMA , SMA , ...) are calculated using two variables: PRICE and TIME.
VWAP brings VOLUME into the equation. It is calculated using three variables: PRICE, TIME and VOLUMES.
This is realty important, because VOLUMES make all the difference!
How to use VWAP in trading?
There are more ways how to trade using the VWAP. The simplest way comes from the logic, that the VWAP represents a "fair value" and that the price should always return to it.
Many trading algorithms work like this: they BUY when the price is BELOW VWAP , and they SELL when the price is ABOVE VWAP .
You can image VWAP (yellow line) as a magnet.
VWAP deviations
The VWAP indicator which I developed has also the option to calculate 1st and 2nd VWAP deviations. Those are standard deviations calculated from the VWAP and they are really useful. In fact, most of my VWAP trading strategies are based on deviations.
Use VWAP deviations to identify TREND and ROTATION
When the Deviations move sideways (horizontally), then there is a ROTATION:
When the Deviations move upwards or downwards (vertically), then there is a TREND:
Sometimes, you can tell whether there is ROTATION or a TREND by just looking at the simple price chart. But there are cases when it is not so clear.
A healthy trend needs to be volume driven. There needs to be big money behind the move (the big guys need to join the party). VWAP and its Deviations reflect that because they track VOLUMES.
That's why they are so good at revealing trends!
In my trading, I like to use the Deviations as Supports and Resistances. The price has nice reactions to them. Especially to the 1st and 2nd Deviation, which I like to use the most in my trading strategies.
A good place for a Take Profit is the yellow VWAP line. The reason is that it works as a magnet - the price tends to return to it.
You can add this script to your chart by clicking "Add to favorite indicators" below.
Have Questions ?
contact@ystc.in
Free Stock Market Introduction Available.
Name: Yogesh Patil (YS Trading Coach).
Contact: +91 9637070868.
Time: Monday to Friday (10:00 AM - 07:00 PM).
초대 전용 스크립트
이 스크립트는 작성자가 승인한 사용자만 접근할 수 있습니다. 사용하려면 요청 후 승인을 받아야 하며, 일반적으로 결제 후에 허가가 부여됩니다. 자세한 내용은 아래 작성자의 안내를 따르거나 YSTradingCoach에게 직접 문의하세요.
이 비공개 초대 전용 스크립트는 스크립트 모더레이터의 검토를 거치지 않았으며, 하우스 룰 준수 여부는 확인되지 않았습니다. 트레이딩뷰는 스크립트의 작동 방식을 충분히 이해하고 작성자를 완전히 신뢰하지 않는 이상, 해당 스크립트에 비용을 지불하거나 사용하는 것을 권장하지 않습니다. 커뮤니티 스크립트에서 무료 오픈소스 대안을 찾아보실 수도 있습니다.
작성자 지시 사항
A PAID Indicator from Volume Profile and VWAP Pack.
According to payment you will either get a TradingView account with indicators activated or
Have to send an email to contact@ystc.in with the email you used to sign up with us, and your TV username.
면책사항
해당 정보와 게시물은 금융, 투자, 트레이딩 또는 기타 유형의 조언이나 권장 사항으로 간주되지 않으며, 트레이딩뷰에서 제공하거나 보증하는 것이 아닙니다. 자세한 내용은 이용 약관을 참조하세요.