OPEN-SOURCE SCRIPT
업데이트됨 Percentage Grid
Percentage Grid Indicator
Description:
The Percentage Grid indicator is designed to assist traders in identifying significant support and resistance levels based on yearly percentage changes. This indicator plots horizontal lines on the chart from the start of the year, allowing you to customize how much percentage each line represents. Currently, you can set up to 5 horizontal lines, each representing a different percentage change from the beginning of the year.
For instance, when applied to the SBI Bank stock, you can customize the lines to display various percentage changes from the start of the year, such as 20%, 25%, and up to 35%, as the SBIN stock is currently trading around these levels. This visualization helps traders to easily identify key levels where price action tends to react, providing valuable insights for making trading decisions.
Principles of Trading Technical Analysis:
The Percentage Grid indicator is grounded in the principle of support and resistance levels, which are fundamental concepts in technical analysis. These levels are specific price points on a chart that tend to act as barriers, preventing the price from getting pushed in a certain direction. The indicator helps in:
Identifying Support Levels: Price levels where a downtrend can be expected to pause due to a concentration of buying interest.
Identifying Resistance Levels: Price levels where an uptrend can be expected to pause due to a concentration of selling interest.
By customizing and plotting percentage-based horizontal lines, the indicator highlights these critical levels based on the percentage change from the start of the year.
How to Use:
Add the Indicator to Your Chart:
Search for "Percentage Grid" in the TradingView indicator library and add it to your chart.
Customize Percentage Levels:
Access the indicator settings to customize the percentage change each line represents.
You can set up to 5 different percentage levels. For example, you can set lines at 20%, 25%, 30%, 35%, and 40%.
Interpret the Grid Lines:
The plotted lines will represent the specified percentage changes from the start of the year.
Use these lines to identify potential support and resistance levels where price action is likely to react.
Practical Application:
Look for price bounces or reversals around these levels, which can indicate strong support or resistance.
Combine the Percentage Grid with other technical analysis tools, such as moving averages or trend lines, to confirm potential trading opportunities.
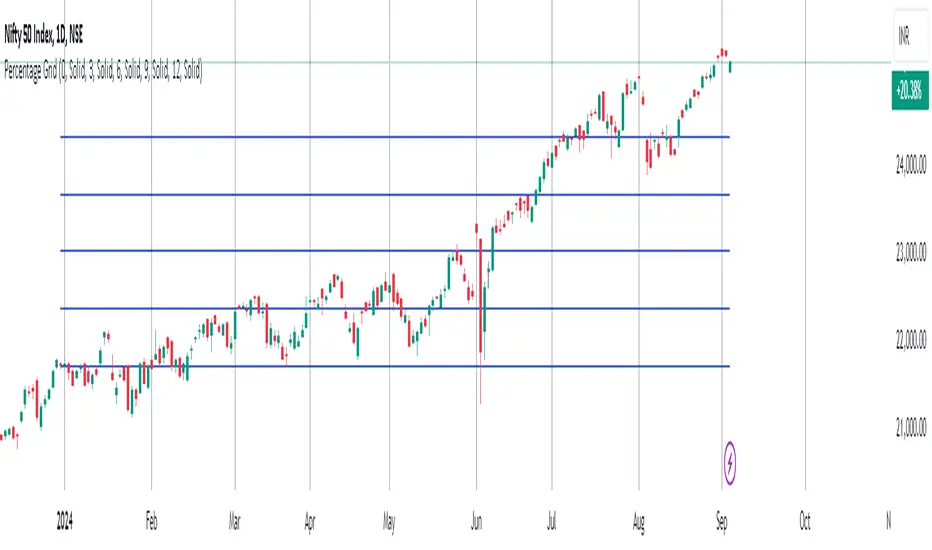
Example:
In the accompanying screenshot, the Percentage Grid is applied to the SBI Bank stock. The lines are set to display 20%, 25%, 30%, 35%, and 40% changes from the start of the year. Notice how the price action respects these levels, providing clear areas where support and resistance are evident.
By incorporating the Percentage Grid into your trading strategy, you can enhance your ability to identify key price levels and make more informed trading decisions.
Happy Trading!
Description:
The Percentage Grid indicator is designed to assist traders in identifying significant support and resistance levels based on yearly percentage changes. This indicator plots horizontal lines on the chart from the start of the year, allowing you to customize how much percentage each line represents. Currently, you can set up to 5 horizontal lines, each representing a different percentage change from the beginning of the year.
For instance, when applied to the SBI Bank stock, you can customize the lines to display various percentage changes from the start of the year, such as 20%, 25%, and up to 35%, as the SBIN stock is currently trading around these levels. This visualization helps traders to easily identify key levels where price action tends to react, providing valuable insights for making trading decisions.
Principles of Trading Technical Analysis:
The Percentage Grid indicator is grounded in the principle of support and resistance levels, which are fundamental concepts in technical analysis. These levels are specific price points on a chart that tend to act as barriers, preventing the price from getting pushed in a certain direction. The indicator helps in:
Identifying Support Levels: Price levels where a downtrend can be expected to pause due to a concentration of buying interest.
Identifying Resistance Levels: Price levels where an uptrend can be expected to pause due to a concentration of selling interest.
By customizing and plotting percentage-based horizontal lines, the indicator highlights these critical levels based on the percentage change from the start of the year.
How to Use:
Add the Indicator to Your Chart:
Search for "Percentage Grid" in the TradingView indicator library and add it to your chart.
Customize Percentage Levels:
Access the indicator settings to customize the percentage change each line represents.
You can set up to 5 different percentage levels. For example, you can set lines at 20%, 25%, 30%, 35%, and 40%.
Interpret the Grid Lines:
The plotted lines will represent the specified percentage changes from the start of the year.
Use these lines to identify potential support and resistance levels where price action is likely to react.
Practical Application:
Look for price bounces or reversals around these levels, which can indicate strong support or resistance.
Combine the Percentage Grid with other technical analysis tools, such as moving averages or trend lines, to confirm potential trading opportunities.
Example:
In the accompanying screenshot, the Percentage Grid is applied to the SBI Bank stock. The lines are set to display 20%, 25%, 30%, 35%, and 40% changes from the start of the year. Notice how the price action respects these levels, providing clear areas where support and resistance are evident.
By incorporating the Percentage Grid into your trading strategy, you can enhance your ability to identify key price levels and make more informed trading decisions.
Happy Trading!
릴리즈 노트
Removed the yearly separator, from the settings box, as it is not required and not used in the indicator. Thanks! 릴리즈 노트
Made some formatting changes and updated default values so that when you add this indicator to the chart, we have some lines plotted already. But to accurately identify important levels it is necessary to update the percentages based on where the chart is trending.Happy trading and Investing :)
오픈 소스 스크립트
트레이딩뷰의 진정한 정신에 따라, 이 스크립트의 작성자는 이를 오픈소스로 공개하여 트레이더들이 기능을 검토하고 검증할 수 있도록 했습니다. 작성자에게 찬사를 보냅니다! 이 코드는 무료로 사용할 수 있지만, 코드를 재게시하는 경우 하우스 룰이 적용된다는 점을 기억하세요.
면책사항
해당 정보와 게시물은 금융, 투자, 트레이딩 또는 기타 유형의 조언이나 권장 사항으로 간주되지 않으며, 트레이딩뷰에서 제공하거나 보증하는 것이 아닙니다. 자세한 내용은 이용 약관을 참조하세요.
오픈 소스 스크립트
트레이딩뷰의 진정한 정신에 따라, 이 스크립트의 작성자는 이를 오픈소스로 공개하여 트레이더들이 기능을 검토하고 검증할 수 있도록 했습니다. 작성자에게 찬사를 보냅니다! 이 코드는 무료로 사용할 수 있지만, 코드를 재게시하는 경우 하우스 룰이 적용된다는 점을 기억하세요.
면책사항
해당 정보와 게시물은 금융, 투자, 트레이딩 또는 기타 유형의 조언이나 권장 사항으로 간주되지 않으며, 트레이딩뷰에서 제공하거나 보증하는 것이 아닙니다. 자세한 내용은 이용 약관을 참조하세요.