INVITE-ONLY SCRIPT
업데이트됨 Inverse Fisher Transform Screener
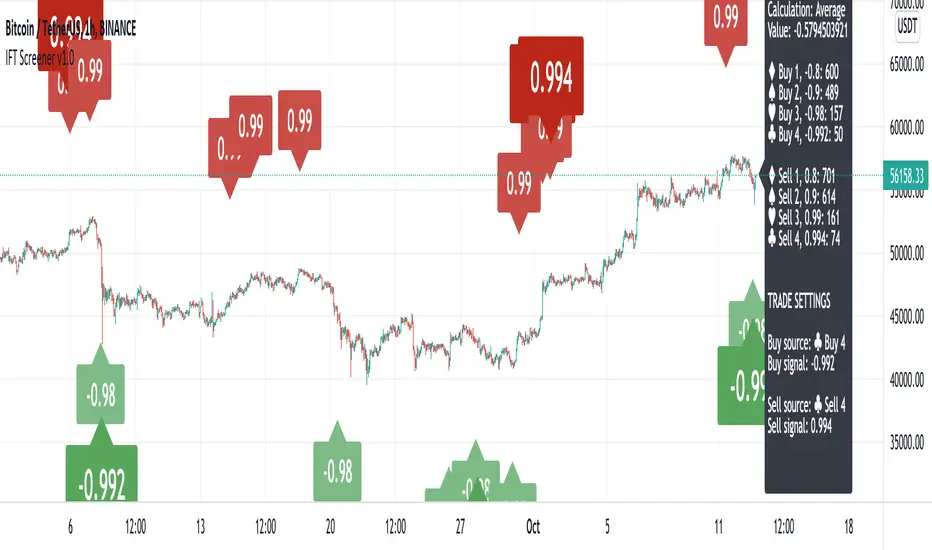
This is a Screener for Inverse Fisher Transform on multiple oscillators
This tool is intended to aid you to visually analyse reasonable buy and sell IFT-signal thresholds across multiple tokens and different sources. It will help you speed up the tedious and manual work of trying out different IFT-settings when you're able to review the chart visually to find which values are present the most often and the location of that signal on the chart.
What does it bring to the table, why is it useful?
- Invese Fisher Transform on multiple oscillators such as RSI, MFI, CCI, Stochastic
- Combine multiple sources into one signal, select how it's calculated
- Visually review the chart for good IFT-settings
- 4 dynamic buy labels with different thresholds
- 4 dynamic sell labels with different thresholds
- Buy and sell on signal reversal
- Create your own trade alerts for automation
- Backtester compatible (plots 1 and 2 for buy and sell signals)
- A dynamic table counting amount of signals for each setting
- The labels are automatically updated when you change the values in the settings
How to use?
1. Change signal source and method
2. Change buy and sell thresholds
3. Show/hide additional labels
4. Review chart
5. Change trade settings
6. Backtest
7. Create alerts
Description
With this indicator you're able to visually review the signal strength of one or multiple oscillators processed with Inverse Fisher Transform ( IFT ), combine them and choose the method of calculation when they are combined. This produces a signal which strongly fluctuates between -1 and +1 instead of the more common 0-100 most oscillators uses. The intention is to make the decision making clearer and easier when you decide when to enter or exit a trade. This aims to help you remove the feelings from your trading.
Inverse Fisher Transform was first presented by John Ehlers in Stocks & Commodities V. 22:5 where he proposes to process RSI with the formula for hyperbolic tangent, tanh (x). This transforms the oscillator into a smoother and more compressed version with quicker oscillations.
릴리즈 노트
Added Absolute Maximum and Absolute Minimum as calculation method for the combined signal. Absolute Maximum uses the value furthest away from the neutral center (+-0) regardless of if it's a positive or negative value. Inverse is true for Absolute Minimum.초대 전용 스크립트
이 스크립트는 작성자가 승인한 사용자만 접근할 수 있습니다. 사용하려면 요청 후 승인을 받아야 하며, 일반적으로 결제 후에 허가가 부여됩니다. 자세한 내용은 아래 작성자의 안내를 따르거나 asterbots에게 직접 문의하세요.
트레이딩뷰는 스크립트의 작동 방식을 충분히 이해하고 작성자를 완전히 신뢰하지 않는 이상, 해당 스크립트에 비용을 지불하거나 사용하는 것을 권장하지 않습니다. 커뮤니티 스크립트에서 무료 오픈소스 대안을 찾아보실 수도 있습니다.
작성자 지시 사항
You can use this script by becoming a VIP member of https://patreon.com/thetradingparrot,
join our discord community at
https://discord.gg/aXD8NGpyuc
면책사항
해당 정보와 게시물은 금융, 투자, 트레이딩 또는 기타 유형의 조언이나 권장 사항으로 간주되지 않으며, 트레이딩뷰에서 제공하거나 보증하는 것이 아닙니다. 자세한 내용은 이용 약관을 참조하세요.
초대 전용 스크립트
이 스크립트는 작성자가 승인한 사용자만 접근할 수 있습니다. 사용하려면 요청 후 승인을 받아야 하며, 일반적으로 결제 후에 허가가 부여됩니다. 자세한 내용은 아래 작성자의 안내를 따르거나 asterbots에게 직접 문의하세요.
트레이딩뷰는 스크립트의 작동 방식을 충분히 이해하고 작성자를 완전히 신뢰하지 않는 이상, 해당 스크립트에 비용을 지불하거나 사용하는 것을 권장하지 않습니다. 커뮤니티 스크립트에서 무료 오픈소스 대안을 찾아보실 수도 있습니다.
작성자 지시 사항
You can use this script by becoming a VIP member of https://patreon.com/thetradingparrot,
join our discord community at
https://discord.gg/aXD8NGpyuc
면책사항
해당 정보와 게시물은 금융, 투자, 트레이딩 또는 기타 유형의 조언이나 권장 사항으로 간주되지 않으며, 트레이딩뷰에서 제공하거나 보증하는 것이 아닙니다. 자세한 내용은 이용 약관을 참조하세요.