OPEN-SOURCE SCRIPT
업데이트됨 Awesome Oscillator with Divergence

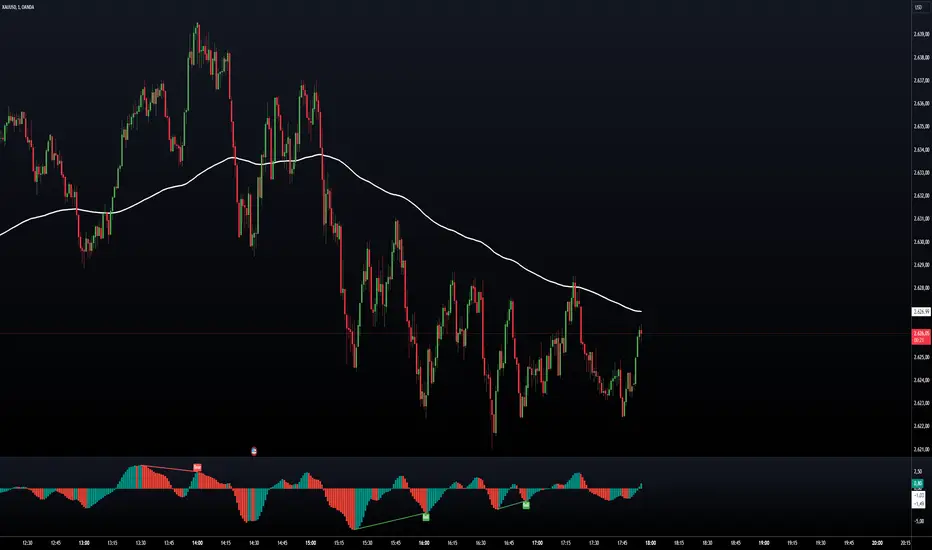
Simple Awesome Oscillator with Divergences
This TradingView script combines the classic Awesome Oscillator (AO) with divergence detection. It plots AO as a histogram, highlighting changes in momentum. Divergences are identified based on pivot highs and lows, signaling potential trend reversals:
- Bullish Divergence: Price makes lower lows, AO makes higher lows.
- Bearish Divergence: Price makes higher highs, AO makes lower highs.
Visual signals (arrows) and alerts ensure clear identification, making it ideal for traders focusing on momentum and trend reversals.
릴리즈 노트
Now the indicator has:Customizable inputs for:
- AO periods (Fast/Slow)
- Choice between Ema and SMA for the calculation of the AO
- Lookback for pivot (right/left)
- Minimum range/maximum for divergence
- Activation/deactivation of any type of divergence (regular/hidden, bullish/bearyish)
- Hidden divergences (Hidden Bullish and Hidden Bearish) with label and dedicated colors
- Alert Condition for each type of divergence
How to use new inputs
- You can choose whether to use Ema (faster) or SMA (slower) for the AO.
- You can activate/deactivate the display of any type of divergence.
- You can adjust the lookback and range parameters directly from the input panel of the indicator.
What changes compared to before
The indicator is now much more flexible and powerful, identical as logic to that "for ideas", but with modern syntax and the possibility to choose between SMA/Ema.
You can adapt the sensitivity and type of signals according to your operational preferences.
릴리즈 노트
Update: The indicator has been downgraded to version 5 because with TradingView's display.pane feature the indicator is inaccurate and was missing important divergences.오픈 소스 스크립트
트레이딩뷰의 진정한 정신에 따라, 이 스크립트의 작성자는 이를 오픈소스로 공개하여 트레이더들이 기능을 검토하고 검증할 수 있도록 했습니다. 작성자에게 찬사를 보냅니다! 이 코드는 무료로 사용할 수 있지만, 코드를 재게시하는 경우 하우스 룰이 적용된다는 점을 기억하세요.
면책사항
해당 정보와 게시물은 금융, 투자, 트레이딩 또는 기타 유형의 조언이나 권장 사항으로 간주되지 않으며, 트레이딩뷰에서 제공하거나 보증하는 것이 아닙니다. 자세한 내용은 이용 약관을 참조하세요.
오픈 소스 스크립트
트레이딩뷰의 진정한 정신에 따라, 이 스크립트의 작성자는 이를 오픈소스로 공개하여 트레이더들이 기능을 검토하고 검증할 수 있도록 했습니다. 작성자에게 찬사를 보냅니다! 이 코드는 무료로 사용할 수 있지만, 코드를 재게시하는 경우 하우스 룰이 적용된다는 점을 기억하세요.
면책사항
해당 정보와 게시물은 금융, 투자, 트레이딩 또는 기타 유형의 조언이나 권장 사항으로 간주되지 않으며, 트레이딩뷰에서 제공하거나 보증하는 것이 아닙니다. 자세한 내용은 이용 약관을 참조하세요.