OPEN-SOURCE SCRIPT
2013-2025 Moon Phases & Mercury Retrogrades
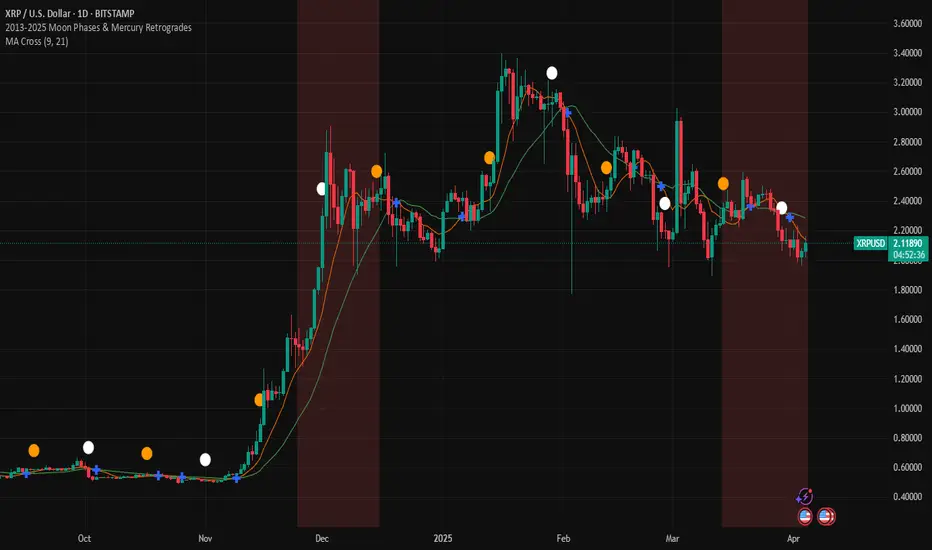
Indicator Description: 2013-2025 Moon Phases & Mercury Retrogrades
This Pine Script (version 5) indicator overlays key astrological events on a TradingView chart, specifically tracking full moons, new moons, and Mercury retrograde periods from 2013 to 2025. It is designed to help traders and astrology enthusiasts visualize these celestial events alongside price action, potentially identifying correlations or patterns.
Features:
New Moons:
Visualization: Plotted as small white circles above the price bars.
Data: Includes 156 specific new moon dates from January 11, 2013, to December 20, 2025.
Purpose: Marks the start of the lunar cycle, often associated with new beginnings or shifts in energy.
Full Moons:
Visualization: Plotted as small orange circles above the price bars.
Data: Includes 157 specific full moon dates from January 27, 2013, to December 15, 2025.
Purpose: Highlights the peak of the lunar cycle, often linked to heightened emotions or market volatility in astrological analysis.
Mercury Retrogrades:
Visualization: Displayed as a light red background highlight across the chart.
Data: Covers 39 Mercury retrograde periods, with precise start and end timestamps from February 23, 2013, to November 29, 2025.
Purpose: Indicates periods traditionally associated with communication issues, delays, or reversals, which some traders monitor for potential market impacts.
Technical Details:
Overlay: The indicator is set to overlay=true, meaning it displays directly on the price chart rather than in a separate pane.
Date Matching: Uses a helper function is_date(y, m, d) to check if the current chart date matches any of the predefined event dates, leveraging TradingView's year, month, and dayofmonth variables.
Visualization Methods:
plotshape: Used for new moons (white circles) and full moons (orange circles), positioned above bars for clear visibility.
bgcolor: Used for Mercury retrograde periods, applying a semi-transparent red highlight (transparency level 85) to the background during active retrograde periods.
Time Range: Spans from January 2013 to December 2025, providing a comprehensive 13-year view of these astrological events.
Usage:
Add the script to your TradingView chart to see new moons, full moons, and Mercury retrograde periods overlaid on your chosen symbol and timeframe.
The white and orange circles appear on specific dates, while the red background highlights extend across the duration of each Mercury retrograde period.
Useful for traders incorporating astrology into their analysis or anyone interested in tracking these celestial events alongside financial data.
Notes:
The script assumes accurate date data as provided; users should verify dates against astronomical sources if precision is critical.
The transparency of the Mercury retrograde background can be adjusted by modifying the value in color.new(color.red, 85) (0 = fully opaque, 100 = fully transparent).
Best viewed on daily or higher timeframes for clarity, though it works on any timeframe supported by TradingView.
This indicator provides a visual tool to explore the potential influence of lunar phases and Mercury retrograde periods on market behavior, blending astrology with technical analysis in a clear, customizable format.
오픈 소스 스크립트
트레이딩뷰의 진정한 정신에 따라, 이 스크립트의 작성자는 이를 오픈소스로 공개하여 트레이더들이 기능을 검토하고 검증할 수 있도록 했습니다. 작성자에게 찬사를 보냅니다! 이 코드는 무료로 사용할 수 있지만, 코드를 재게시하는 경우 하우스 룰이 적용된다는 점을 기억하세요.
면책사항
해당 정보와 게시물은 금융, 투자, 트레이딩 또는 기타 유형의 조언이나 권장 사항으로 간주되지 않으며, 트레이딩뷰에서 제공하거나 보증하는 것이 아닙니다. 자세한 내용은 이용 약관을 참조하세요.
오픈 소스 스크립트
트레이딩뷰의 진정한 정신에 따라, 이 스크립트의 작성자는 이를 오픈소스로 공개하여 트레이더들이 기능을 검토하고 검증할 수 있도록 했습니다. 작성자에게 찬사를 보냅니다! 이 코드는 무료로 사용할 수 있지만, 코드를 재게시하는 경우 하우스 룰이 적용된다는 점을 기억하세요.
면책사항
해당 정보와 게시물은 금융, 투자, 트레이딩 또는 기타 유형의 조언이나 권장 사항으로 간주되지 않으며, 트레이딩뷰에서 제공하거나 보증하는 것이 아닙니다. 자세한 내용은 이용 약관을 참조하세요.