OPEN-SOURCE SCRIPT
업데이트됨 3x Supertrend + EMA200 Signal Buy/Sell [nsen]

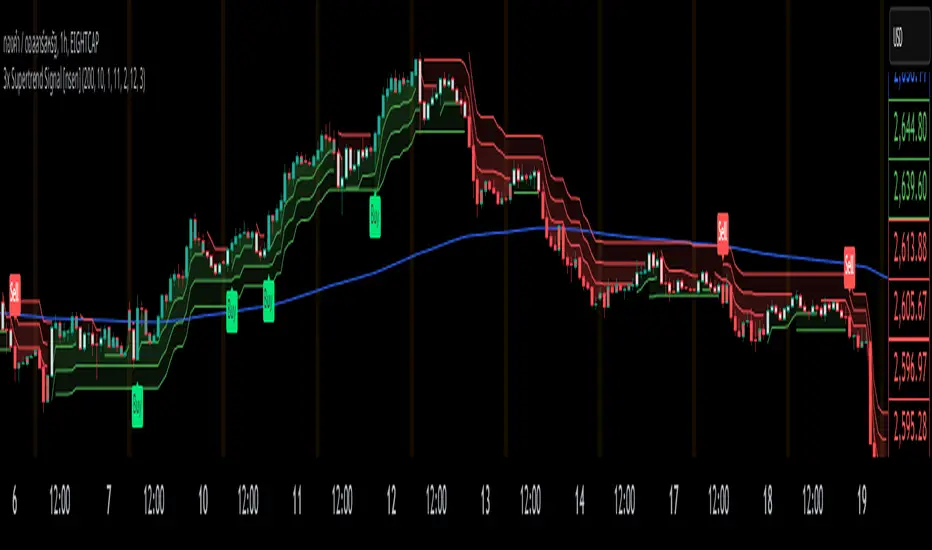
The indicator uses signals from three Supertrend lines to determine whether to trade Buy or Sell, with the assistance of a moving average for bias.
Buy/Sell signals are generated when the conditions are met:
A Buy signal is triggered when all three Supertrend lines indicate a bullish trend and are above the EMA.
A Sell signal is triggered when all three Supertrend lines indicate a bearish trend and are below the EMA.
Indicator ใช้สัญญาณจาก Supertrend ทั้งหมด 3 เส้น โดยใช้ในการกำหนดว่าจะเลือกเทรด Buy หรือ Sell โดยการใช้ moveing average เข้ามาช่วยในการ bias
แสดงสัญญาณ Buy/Sell เมื่อเข้าเงื่อนไข
- Supertrend ทั้ง 3 เส้นเป็นสัญญาณ Bullish และอยู่เหนือเส้น EMA จะเปิดสัญญาณ Buy
- Supertrend ทั้ง 3 เส้นเป็นสัญญาณ Bearish และอยู่ใต้เส้น EMA จะเปิดสัญญาณ Sell
릴리즈 노트
Indicator Name: Multi-Supertrend with EMA ConfirmationConcept and Functionality
This indicator combines three Supertrend levels (Fast, Medium, Slow) with an Exponential Moving Average (EMA) to detect market trends and generate more reliable buy/sell signals.
• Supertrend Indicator is a trend-following tool that uses the Average True Range (ATR) to create dynamic support and resistance levels.
• EMA (Exponential Moving Average) acts as an additional trend filter to reduce false signals.
This indicator is designed to help traders identify market trends and precise entry points using a multi-timeframe confirmation approach.
===========================================
Calculation and Key Components
EMA (Exponential Moving Average)
• Uses a 200-period EMA as a dynamic support/resistance level.
• Price closing above the EMA suggests an uptrend.
• Price closing below the EMA suggests a downtrend.
Three Supertrend Levels
• Each Supertrend is calculated using different ATR lengths and factors (Fast, Medium, Slow).
• Helps detect trend direction and potential reversals.
Trend Identification
• Bullish Trend: All three Supertrend lines are in an uptrend, and price is above the EMA.
• Bearish Trend: All three Supertrend lines are in a downtrend, and price is below the EMA.
• Neutral Trend: When the Supertrend signals are mixed.
Candle Coloring for Trend Visualization
• Green: Strong uptrend (All three Supertrends are bullish).
• Red: Strong downtrend (All three Supertrends are bearish).
• Lighter colors: Transition phases.
Buy/Sell Signal Conditions
• Buy Signal:
- All three Supertrend lines are bullish.
- Price is above the EMA.
- Trend shift from bearish to bullish.
• Sell Signal:
- All three Supertrend lines are bearish.
- Price is below the EMA.
- Trend shift from bullish to bearish.
Alerts System
• The indicator includes built-in alerts when buy or sell signals are triggered based on the conditions above.
오픈 소스 스크립트
트레이딩뷰의 진정한 정신에 따라, 이 스크립트의 작성자는 이를 오픈소스로 공개하여 트레이더들이 기능을 검토하고 검증할 수 있도록 했습니다. 작성자에게 찬사를 보냅니다! 이 코드는 무료로 사용할 수 있지만, 코드를 재게시하는 경우 하우스 룰이 적용된다는 점을 기억하세요.
면책사항
해당 정보와 게시물은 금융, 투자, 트레이딩 또는 기타 유형의 조언이나 권장 사항으로 간주되지 않으며, 트레이딩뷰에서 제공하거나 보증하는 것이 아닙니다. 자세한 내용은 이용 약관을 참조하세요.
오픈 소스 스크립트
트레이딩뷰의 진정한 정신에 따라, 이 스크립트의 작성자는 이를 오픈소스로 공개하여 트레이더들이 기능을 검토하고 검증할 수 있도록 했습니다. 작성자에게 찬사를 보냅니다! 이 코드는 무료로 사용할 수 있지만, 코드를 재게시하는 경우 하우스 룰이 적용된다는 점을 기억하세요.
면책사항
해당 정보와 게시물은 금융, 투자, 트레이딩 또는 기타 유형의 조언이나 권장 사항으로 간주되지 않으며, 트레이딩뷰에서 제공하거나 보증하는 것이 아닙니다. 자세한 내용은 이용 약관을 참조하세요.