OPEN-SOURCE SCRIPT
FIB Band Signals with RSI Filter
Original Author: Rashad
Added by Rashad 6-26-16
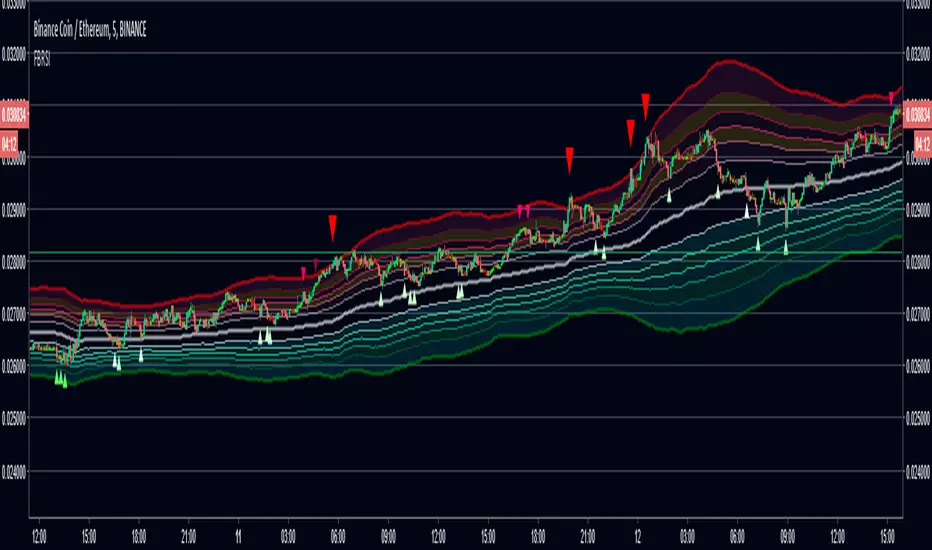
These Bollinger bands feature Fibonacci retracements to very clearly show areas of support and resistance . The basis is calculate off of the Volume Weighted Moving Average . The Bands are 3 standard deviations away from the mean. 99.73% of observations should be in this range.
Updated by Dysrupt 7-12-18
-Buy signals added on lower bands, mean and upper 3 bands
-Sell signals added to upper 3 bands
-RSI filter applied to signals
-Alerts not yet added
-Long Biased
NOTE: This is NOT a set and forget signal indicator. It is extremely versatile for all environments by adjusting the RSI filter and checking the band signals needed for the current trend and trading style.
Added by Rashad 6-26-16
These Bollinger bands feature Fibonacci retracements to very clearly show areas of support and resistance . The basis is calculate off of the Volume Weighted Moving Average . The Bands are 3 standard deviations away from the mean. 99.73% of observations should be in this range.
Updated by Dysrupt 7-12-18
-Buy signals added on lower bands, mean and upper 3 bands
-Sell signals added to upper 3 bands
-RSI filter applied to signals
-Alerts not yet added
-Long Biased
NOTE: This is NOT a set and forget signal indicator. It is extremely versatile for all environments by adjusting the RSI filter and checking the band signals needed for the current trend and trading style.
오픈 소스 스크립트
트레이딩뷰의 진정한 정신에 따라, 이 스크립트의 작성자는 이를 오픈소스로 공개하여 트레이더들이 기능을 검토하고 검증할 수 있도록 했습니다. 작성자에게 찬사를 보냅니다! 이 코드는 무료로 사용할 수 있지만, 코드를 재게시하는 경우 하우스 룰이 적용된다는 점을 기억하세요.
면책사항
해당 정보와 게시물은 금융, 투자, 트레이딩 또는 기타 유형의 조언이나 권장 사항으로 간주되지 않으며, 트레이딩뷰에서 제공하거나 보증하는 것이 아닙니다. 자세한 내용은 이용 약관을 참조하세요.
오픈 소스 스크립트
트레이딩뷰의 진정한 정신에 따라, 이 스크립트의 작성자는 이를 오픈소스로 공개하여 트레이더들이 기능을 검토하고 검증할 수 있도록 했습니다. 작성자에게 찬사를 보냅니다! 이 코드는 무료로 사용할 수 있지만, 코드를 재게시하는 경우 하우스 룰이 적용된다는 점을 기억하세요.
면책사항
해당 정보와 게시물은 금융, 투자, 트레이딩 또는 기타 유형의 조언이나 권장 사항으로 간주되지 않으며, 트레이딩뷰에서 제공하거나 보증하는 것이 아닙니다. 자세한 내용은 이용 약관을 참조하세요.