OPEN-SOURCE SCRIPT
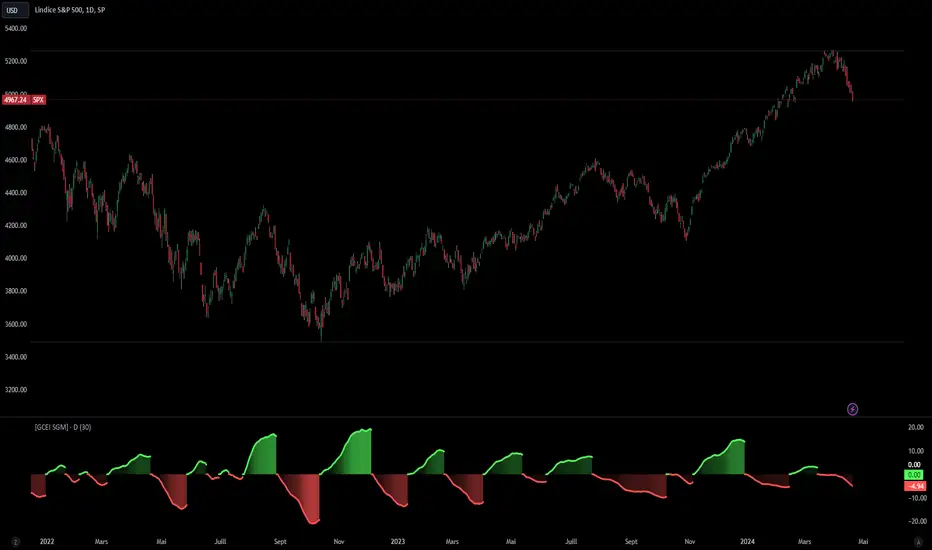
[Global Contraction Expansion Index SGM]
Script Features
Dynamic Period Choice: The user can adjust the calculation period (period) for relative performance, allowing flexibility according to specific market analysis needs.
Sector Selection: The script takes into account different economic sectors through well-known ETFs like QQQ (technology), XLF (financial), XLY (consumer discretionary), XLV (healthcare), XLI (industrial) and XLE (energy). This diversification helps gain a general overview of economic health across different market segments.
Relative Performance Calculation: For each sector, the script calculates the relative performance using a simple moving average (SMA) of the price change over the specified period. This helps identify price trends adjusted for normal market fluctuations.
GCEI Index: The GCEI Index is calculated as the average of the relative performance of all sectors, multiplied by 100 to express it as a percentage. This provides an overall indicator of sectoral economic performance.
Crossover Signals: The script detects and marks points where the overall index (GCEI) crosses its own exponential moving average (emaGCEI), indicating potential changes in the overall trend of market performance.
Visualization: Results are visualized through graphs, where positive and negative regions are colored differently. Fills between the zero line and the index curves make it easy to see periods of contraction or expansion
When this index diverges from the SP500, it may be a sign that the technology sector is outperforming other sectors.
오픈 소스 스크립트
트레이딩뷰의 진정한 정신에 따라, 이 스크립트의 작성자는 이를 오픈소스로 공개하여 트레이더들이 기능을 검토하고 검증할 수 있도록 했습니다. 작성자에게 찬사를 보냅니다! 이 코드는 무료로 사용할 수 있지만, 코드를 재게시하는 경우 하우스 룰이 적용된다는 점을 기억하세요.
Sigaud | Junior Quantitative Trader & Developer
Combining technical expertise with analytical precision.
Gaining experience and growing in the field.
📧 Contact: from the website
Combining technical expertise with analytical precision.
Gaining experience and growing in the field.
📧 Contact: from the website
면책사항
해당 정보와 게시물은 금융, 투자, 트레이딩 또는 기타 유형의 조언이나 권장 사항으로 간주되지 않으며, 트레이딩뷰에서 제공하거나 보증하는 것이 아닙니다. 자세한 내용은 이용 약관을 참조하세요.