INVITE-ONLY SCRIPT
업데이트됨 !BooM!
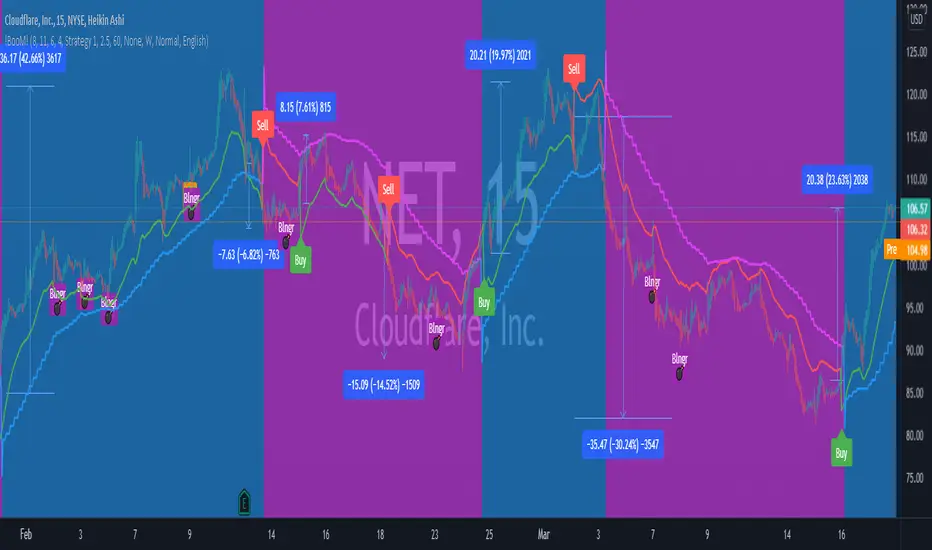
Hello
The indicator measures the relationship between Average True Range (ATR) that shows how much an asset moves, on average, during a given time frame and Standard Deviation that measuring how widely asset prices are dispersed from the average price. If prices trade in a narrow trading range, the relationship between the ATR and SD will return a low value that indicates low volatility that will lead to potential price quick movement.
To increase the accuracy of the indicator and reduce false signals, it generates three circles, each indicate protentional price quick movement coming. For circle to print, following criteria must meet:
• Green Circle is based on low volatility and both ATR and SD are at minimum value for a short pre-defined time frame.
• Magenta Circle is based on low volatility and SD are at minimum value for a long pre-defined time frame.
• Yellow Circle is based on low volatility and SD are at minimum value for a short pre-defined time frame and Average Directional Movement Index reaching to pre-defined level.
The indicator focuses mainly on identifying potential price quick movement. However, it is equipped with two signal that is generated upon crossing the keltner channel upper or lower bands to help identifying the direction of the price movements but the user shall study the chart on big time frame to confirm the direction of the price movement.
If you would like to use it, please drop a message or find other contact under my signature.
After purchase, open the TradingView indicator library. Under the Invite-Only Scripts section, you will see it. Add it to your chart and save your chart layout.
릴리즈 노트
New release to add text to circle shapesGreen circle: "Mid" mean Medium low volatility signal.
Fuchsia circle: "High" mean Very low volatility signal.
Yellow circle: "ADX" squeeze linked with Average Directional Movement Index.
릴리즈 노트
Added input to enable or disable trend signals 릴리즈 노트
Combine all signals into one signal. When all are signals are valid then signal plotted 릴리즈 노트
The new version segregated the ADX - MACD - BB @=& Keltner Squeeze signals so the user can complain and tune the settings to best provide excellent exposition signals 릴리즈 노트
Add the Bottom and Top Expert릴리즈 노트
Included the top and bottom advisor .اضافه خبير القمم والقيعان
릴리즈 노트
Changed the default parameters 릴리즈 노트
Add option to enable the bottom and top signals릴리즈 노트
Enable adjusting the top and bottom levels릴리즈 노트
Added a feature to change the time farm of bottom and Top expert. 릴리즈 노트
Enable alerts for Supper Trends as well the top and bottom levels릴리즈 노트
Added Pivot Points (Support & Resistance)릴리즈 노트
Improved the bottom and top calculations릴리즈 노트
Automate the indicator seetings according to the ticker timeframe and price volatility (Auto Drive mode!)Also include a panel that shows the price basic information such as pivots support and resistance, Moving Averages, 52 week high and low and daily average price range.
릴리즈 노트
Improved the setting automation part, strengthen the trend algo signals and added technical analysis's report. 릴리즈 노트
enable plotting the support and resistance on the chart with other miner modifiications 릴리즈 노트
تعديلات على الاعدادات الافتراضيه لنقاط الدعم والمقاومه تغير من خط مستقيم الى نقاط릴리즈 노트
Combine all alerts into one alert to easy the use of boom and trend buy/sell signals use. 릴리즈 노트
Miner modification for the trend algo to allow quick signal hunt. 릴리즈 노트
Add a trend algo continuation signal to enable trades to evaluate reentrance . Adjust any alert function to alert on candle close. 릴리즈 노트
Added a filter to the trend algo to enable capturing strong trend signals 릴리즈 노트
Fix the report issue 릴리즈 노트
Update the indicator to automate the factor of the trend to enable automatic changes릴리즈 노트
The new release includes the followings:1. Modify the report to and classify it according to trend/momentum/volatility and volume.
2. Includes Candlestick pattern
3. Includes RSI, MACD and Stochastics divergence.
4. Added Price targets
5. Enhanced the alert setup.
릴리즈 노트
Updates includes:Enable Alerts for :
1. Ultra High Volume
2. Money Flow
3. Ichimoku cloud breakout
4. Divergence (RSI/MACD/STO/OBV)
5.Trend Breackout
Trend plot added to the chart
릴리즈 노트
include ultra high volume and ichimoku cloud signals in the chart. you can enable or disable them릴리즈 노트
Filter the repeated ultra high volume signals as well improved the breakout signals릴리즈 노트
Modify the text for the alerts update as well add label for the ultra high volume 릴리즈 노트
New features added:Auto trailing stop.
Profit Target shown only for last Signal
Shows Ultra high volume candle and breakouts signals
and other improvements
릴리즈 노트
Enabled two breakout strategies to allow end user select the right strategy that suite his trading style. 릴리즈 노트
Adjust the target label values. Enable displaying the VWAP and its bands 릴리즈 노트
Adjust the second strategy parameters 릴리즈 노트
Add a second trend line to allow trader know the trend path on bigger timeframe. 릴리즈 노트
Fixed Strat 1 signals calculations릴리즈 노트
Improved the alert for the buy signal릴리즈 노트
Enhanced and fixed the repetitive alerts as well modified the alerts to show the period at which alert occurred. 릴리즈 노트
adjust the alert to avoid continuous alert. 초대 전용 스크립트
이 스크립트는 작성자가 승인한 사용자만 접근할 수 있습니다. 사용하려면 요청 후 승인을 받아야 하며, 일반적으로 결제 후에 허가가 부여됩니다. 자세한 내용은 아래 작성자의 안내를 따르거나 dndn1에게 직접 문의하세요.
트레이딩뷰는 스크립트의 작동 방식을 충분히 이해하고 작성자를 완전히 신뢰하지 않는 이상, 해당 스크립트에 비용을 지불하거나 사용하는 것을 권장하지 않습니다. 커뮤니티 스크립트에서 무료 오픈소스 대안을 찾아보실 수도 있습니다.
작성자 지시 사항
Please contact me for addition Information
Email: optionstradeideas@gmail.com
Telegram: t.me/abuturki_99
Telegram: t.me/abuturki_99
면책사항
해당 정보와 게시물은 금융, 투자, 트레이딩 또는 기타 유형의 조언이나 권장 사항으로 간주되지 않으며, 트레이딩뷰에서 제공하거나 보증하는 것이 아닙니다. 자세한 내용은 이용 약관을 참조하세요.
초대 전용 스크립트
이 스크립트는 작성자가 승인한 사용자만 접근할 수 있습니다. 사용하려면 요청 후 승인을 받아야 하며, 일반적으로 결제 후에 허가가 부여됩니다. 자세한 내용은 아래 작성자의 안내를 따르거나 dndn1에게 직접 문의하세요.
트레이딩뷰는 스크립트의 작동 방식을 충분히 이해하고 작성자를 완전히 신뢰하지 않는 이상, 해당 스크립트에 비용을 지불하거나 사용하는 것을 권장하지 않습니다. 커뮤니티 스크립트에서 무료 오픈소스 대안을 찾아보실 수도 있습니다.
작성자 지시 사항
Please contact me for addition Information
Email: optionstradeideas@gmail.com
Telegram: t.me/abuturki_99
Telegram: t.me/abuturki_99
면책사항
해당 정보와 게시물은 금융, 투자, 트레이딩 또는 기타 유형의 조언이나 권장 사항으로 간주되지 않으며, 트레이딩뷰에서 제공하거나 보증하는 것이 아닙니다. 자세한 내용은 이용 약관을 참조하세요.