PROTECTED SOURCE SCRIPT
[DEM] Donchian Cloud
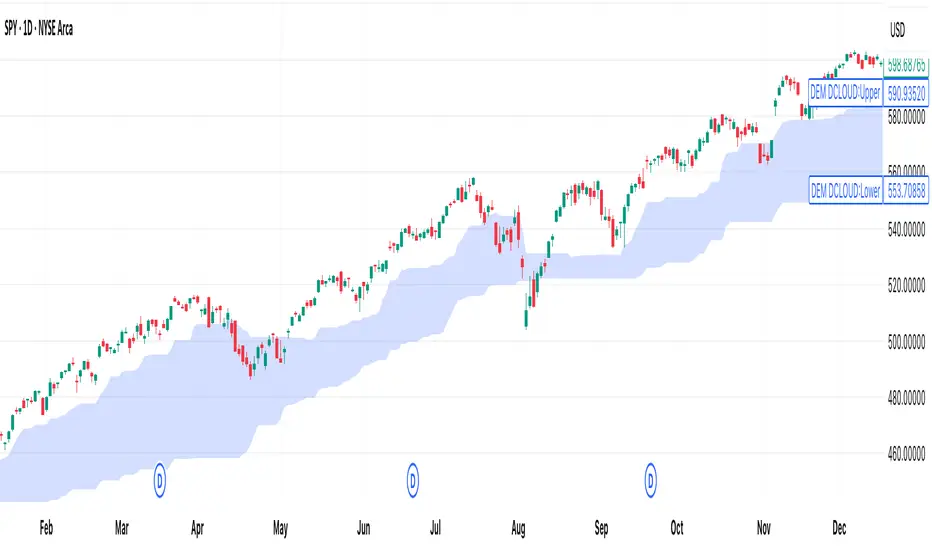
[DEM] Donchian Cloud is designed to create a visual cloud overlay on the price chart using two Donchian Channel midlines of different periods (26 and 117 bars) to identify trend direction and potential support/resistance zones. The indicator calculates the average of the highest high and lowest low for each period, plots these as nearly transparent blue lines, and fills the area between them with a color-coded cloud that changes from blue to red when the longer-period midline (117) crosses above the shorter-period midline (26), indicating a potential bearish shift in the longer-term trend. This cloud system helps traders visualize the relationship between short-term and long-term price equilibrium levels, with the cloud color providing a quick reference for overall trend bias and the cloud boundaries offering dynamic support and resistance levels.
보호된 스크립트입니다
이 스크립트는 비공개 소스로 게시됩니다. 하지만 이를 자유롭게 제한 없이 사용할 수 있습니다 – 자세한 내용은 여기에서 확인하세요.
면책사항
해당 정보와 게시물은 금융, 투자, 트레이딩 또는 기타 유형의 조언이나 권장 사항으로 간주되지 않으며, 트레이딩뷰에서 제공하거나 보증하는 것이 아닙니다. 자세한 내용은 이용 약관을 참조하세요.
보호된 스크립트입니다
이 스크립트는 비공개 소스로 게시됩니다. 하지만 이를 자유롭게 제한 없이 사용할 수 있습니다 – 자세한 내용은 여기에서 확인하세요.
면책사항
해당 정보와 게시물은 금융, 투자, 트레이딩 또는 기타 유형의 조언이나 권장 사항으로 간주되지 않으며, 트레이딩뷰에서 제공하거나 보증하는 것이 아닙니다. 자세한 내용은 이용 약관을 참조하세요.