OPEN-SOURCE SCRIPT
업데이트됨 Super Cycle Low Finder
How the Indicator Works
1. Inputs
Users can adjust the cycle lengths:
Daily Cycle: Default is 40 days (within 36-44 days).
Weekly Cycle: Default is 26 weeks (182 days, within 22-31 weeks).
Yearly Cycle: Default is 4 years (1460 days).
2. Cycle Low Detection
Function: detect_cycle_low finds the lowest low over the specified period and confirms it with a bullish candle (close > open).
Timeframes: Daily lows are calculated directly; weekly and yearly lows use request.security to fetch data from higher timeframes.
3. Half Cycle Lows
Detected over half the cycle length, plotted to show mid-cycle strength or weakness.
4. Cycle Translation
Logic: Compares the position of the highest high to the cycle’s midpoint.
Output: "R" for right translated (bullish), "L" for left translated (bearish), displayed above bars.
5. Cycle Failure
Flags when a new low falls below the previous cycle low, indicating a breakdown.
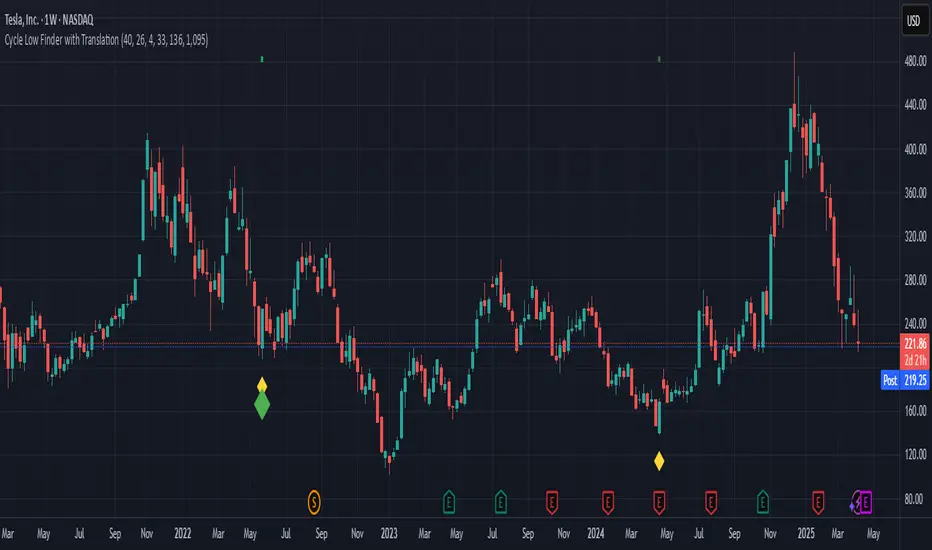
6. Visualization
Cycle Lows: Diamonds below bars (yellow for daily, green for weekly, blue for yearly).
Half Cycle Lows: Circles below bars (orange, lime, aqua).
Translations: "R" or "L" above bars in distinct colors.
Failures: Downward triangles below bars (red, orange, purple).
1. Inputs
Users can adjust the cycle lengths:
Daily Cycle: Default is 40 days (within 36-44 days).
Weekly Cycle: Default is 26 weeks (182 days, within 22-31 weeks).
Yearly Cycle: Default is 4 years (1460 days).
2. Cycle Low Detection
Function: detect_cycle_low finds the lowest low over the specified period and confirms it with a bullish candle (close > open).
Timeframes: Daily lows are calculated directly; weekly and yearly lows use request.security to fetch data from higher timeframes.
3. Half Cycle Lows
Detected over half the cycle length, plotted to show mid-cycle strength or weakness.
4. Cycle Translation
Logic: Compares the position of the highest high to the cycle’s midpoint.
Output: "R" for right translated (bullish), "L" for left translated (bearish), displayed above bars.
5. Cycle Failure
Flags when a new low falls below the previous cycle low, indicating a breakdown.
6. Visualization
Cycle Lows: Diamonds below bars (yellow for daily, green for weekly, blue for yearly).
Half Cycle Lows: Circles below bars (orange, lime, aqua).
Translations: "R" or "L" above bars in distinct colors.
Failures: Downward triangles below bars (red, orange, purple).
릴리즈 노트
How the Indicator Works1. Inputs
Users can adjust the cycle lengths:
Daily Cycle: Default is 40 days (within 36-44 days).
Weekly Cycle: Default is 26 weeks (182 days, within 22-31 weeks).
Yearly Cycle: Default is 4 years (1460 days).
2. Cycle Low Detection
Function: detect_cycle_low finds the lowest low over the specified period and confirms it with a bullish candle (close > open).
Timeframes: Daily lows are calculated directly; weekly and yearly lows use request.security to fetch data from higher timeframes.
3. Half Cycle Lows
Detected over half the cycle length, plotted to show mid-cycle strength or weakness.
4. Cycle Translation
Logic: Compares the position of the highest high to the cycle’s midpoint.
Output: "R" for right translated (bullish), "L" for left translated (bearish), displayed above bars.
5. Cycle Failure
Flags when a new low falls below the previous cycle low, indicating a breakdown.
6. Visualization
Cycle Lows: Diamonds below bars (yellow for daily, green for weekly, blue for yearly).
Half Cycle Lows: Circles below bars (orange, lime, aqua).
Translations: "R" or "L" above bars in distinct colors.
Failures: Downward triangles below bars (red, orange, purple).
릴리즈 노트
How Cycle Translation Works in the IndicatorKey Logic
Cycle Midpoint: For each cycle (e.g., 40 days for daily), the midpoint is calculated as half the cycle length (e.g., 20 days).
Cycle High: The highest high between two consecutive cycle lows is identified.
Translation Determination:
Right Translated (RT): If the cycle high occurs after the midpoint (fewer bars since the high than the midpoint), it’s bullish.
Left Translated (LT): If the cycle high occurs before the midpoint (more bars since the high than the midpoint), it’s bearish.
릴리즈 노트
bugs fixed릴리즈 노트
fixed릴리즈 노트
update오픈 소스 스크립트
트레이딩뷰의 진정한 정신에 따라, 이 스크립트의 작성자는 이를 오픈소스로 공개하여 트레이더들이 기능을 검토하고 검증할 수 있도록 했습니다. 작성자에게 찬사를 보냅니다! 이 코드는 무료로 사용할 수 있지만, 코드를 재게시하는 경우 하우스 룰이 적용된다는 점을 기억하세요.
면책사항
해당 정보와 게시물은 금융, 투자, 트레이딩 또는 기타 유형의 조언이나 권장 사항으로 간주되지 않으며, 트레이딩뷰에서 제공하거나 보증하는 것이 아닙니다. 자세한 내용은 이용 약관을 참조하세요.
오픈 소스 스크립트
트레이딩뷰의 진정한 정신에 따라, 이 스크립트의 작성자는 이를 오픈소스로 공개하여 트레이더들이 기능을 검토하고 검증할 수 있도록 했습니다. 작성자에게 찬사를 보냅니다! 이 코드는 무료로 사용할 수 있지만, 코드를 재게시하는 경우 하우스 룰이 적용된다는 점을 기억하세요.
면책사항
해당 정보와 게시물은 금융, 투자, 트레이딩 또는 기타 유형의 조언이나 권장 사항으로 간주되지 않으며, 트레이딩뷰에서 제공하거나 보증하는 것이 아닙니다. 자세한 내용은 이용 약관을 참조하세요.