OPEN-SOURCE SCRIPT
SMA Buy/Sell Strategy with Significant Slope and Dynamic TP/SL
Description:
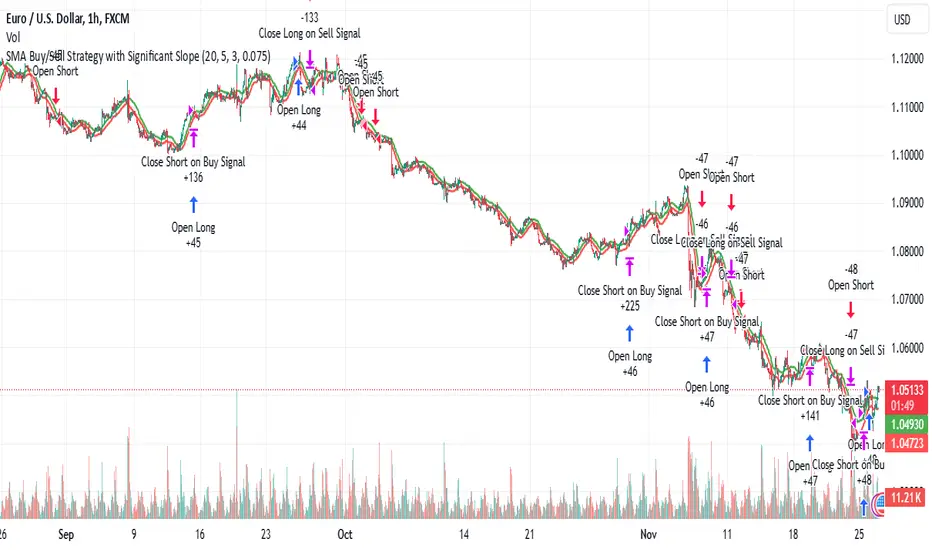
This strategy uses a simple moving average (SMA) to detect trading opportunities based on the slope and proximity of price action. It ensures trades are only executed during significant trends, reducing false signals caused by sideways movements. The strategy incorporates dynamic risk management with an initial ambitious Take Profit (TP) and a Trailing Stop Loss (SL) to protect profits.
Key Features:
Trend Detection with SMA:
Two SMAs are calculated: one on High values and one on Low values.
Signals are generated when the price crosses these SMAs, ensuring:
Buy: Price closes above the SMA on High, with a significant upward slope.
Sell: Price closes below the SMA on Low, with a significant downward slope.
Slope Significance Check:
The slope of the SMA is calculated over a configurable period.
Only trends with a slope variation exceeding a user-defined percentage threshold are considered significant.
Dynamic Risk Management:
Ambitious Initial TP: Positions target a high percentage gain upon entry.
Trailing SL: Automatically adjusts as the price moves in favor of the trade, locking in profits.
Automatic Position Management:
Opposing signals close existing positions to avoid conflicting trades.
Configurable position size for risk control.
Parameters:
SMA Period: Number of candles for calculating the SMA.
Initial Take Profit (%): Percentage gain for the initial TP.
Trailing Stop Loss (%): Percentage for trailing SL based on the current price.
Slope Threshold (%): Minimum percentage change in SMA slope to confirm trend significance.
How It Works:
Buy Signal:
The price closes above the SMA on High values.
The slope of the SMA (on High) is positive and exceeds the slope threshold.
Sell Signal:
The price closes below the SMA on Low values.
The slope of the SMA (on Low) is negative and exceeds the slope threshold.
Exits:
A position closes at the Take Profit level, Trailing Stop Loss, or when an opposing signal is generated.
Use Case:
This strategy is ideal for trending markets where price action respects moving averages. It can be used on any timeframe or asset but is particularly effective in markets with clear directional movements.
Recommended Settings:
Timeframe: Works well on higher timeframes (e.g., 1H, 4H, Daily).
Slope Threshold (%): Default is 5%, adjust based on market volatility.
Initial TP and Trailing SL: Tailor to your risk/reward preferences.
By utilizing this strategy, traders can capitalize on significant market trends while dynamically managing risk. Test it on historical data to optimize the parameters for your preferred market!
오픈 소스 스크립트
트레이딩뷰의 진정한 정신에 따라, 이 스크립트의 작성자는 이를 오픈소스로 공개하여 트레이더들이 기능을 검토하고 검증할 수 있도록 했습니다. 작성자에게 찬사를 보냅니다! 이 코드는 무료로 사용할 수 있지만, 코드를 재게시하는 경우 하우스 룰이 적용된다는 점을 기억하세요.
면책사항
해당 정보와 게시물은 금융, 투자, 트레이딩 또는 기타 유형의 조언이나 권장 사항으로 간주되지 않으며, 트레이딩뷰에서 제공하거나 보증하는 것이 아닙니다. 자세한 내용은 이용 약관을 참조하세요.
오픈 소스 스크립트
트레이딩뷰의 진정한 정신에 따라, 이 스크립트의 작성자는 이를 오픈소스로 공개하여 트레이더들이 기능을 검토하고 검증할 수 있도록 했습니다. 작성자에게 찬사를 보냅니다! 이 코드는 무료로 사용할 수 있지만, 코드를 재게시하는 경우 하우스 룰이 적용된다는 점을 기억하세요.
면책사항
해당 정보와 게시물은 금융, 투자, 트레이딩 또는 기타 유형의 조언이나 권장 사항으로 간주되지 않으며, 트레이딩뷰에서 제공하거나 보증하는 것이 아닙니다. 자세한 내용은 이용 약관을 참조하세요.