OPEN-SOURCE SCRIPT
업데이트됨 ATR and Volume Analysis
Hi!
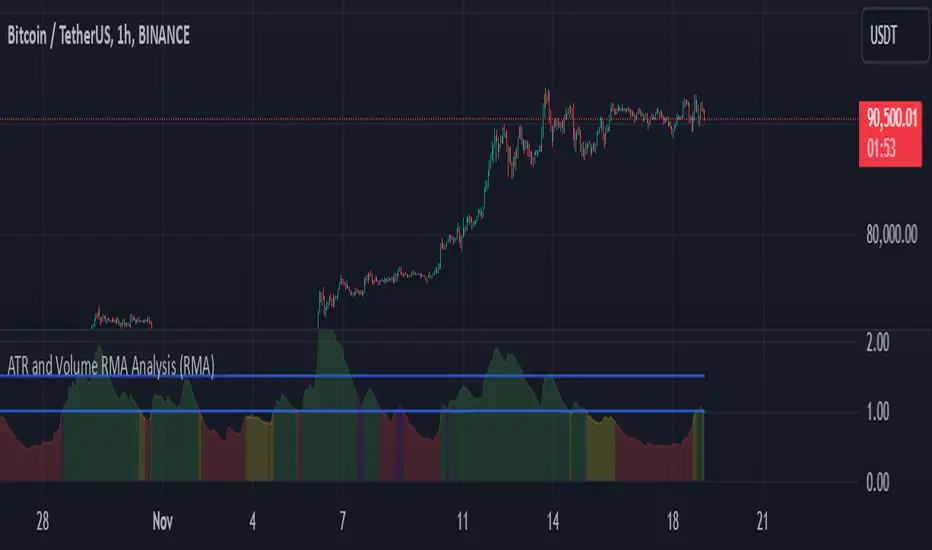
I would like to present an indicator that's meant to measure ratio of Volatility to Volume.
Basically it measures 2 moving averages (14 and 100 period) of ATR and Volume and then compares them. The output is ATR14 / Vol14
Color scheme
Red: Volume and ATR is both below 14 period
Green: Both are above
Yellow: Volume up, volatility down
Purple: Volume down, volatility up
Then there are two lines - 1 and 1.5
That is, in my opinion, the most optimal state to trade, because 1 means that there is some volatility and it's confirmed by volume. Above 1,5 you could see it as overbought (or oversold) zone. If it's above this line, we could expect a retracement since the volatility is not backed by volume. Above 2 it's quite critical and I would suggest closing trades.
(You can use it across all timeframes. In fact it's better if you do so. Longer timeframes are good for spotting tradeable markets while shorter timeframes show overbought / oversold zones)
I have also added option to choose between 4 different moving averages, but in my opinion RMA works the best.
Feel free to share some feedback, I would really appreciate it.
Sincerely,
Beefmaster
릴리즈 노트
Update: Removed other indicators to match the house rules.오픈 소스 스크립트
트레이딩뷰의 진정한 정신에 따라, 이 스크립트의 작성자는 이를 오픈소스로 공개하여 트레이더들이 기능을 검토하고 검증할 수 있도록 했습니다. 작성자에게 찬사를 보냅니다! 이 코드는 무료로 사용할 수 있지만, 코드를 재게시하는 경우 하우스 룰이 적용된다는 점을 기억하세요.
면책사항
해당 정보와 게시물은 금융, 투자, 트레이딩 또는 기타 유형의 조언이나 권장 사항으로 간주되지 않으며, 트레이딩뷰에서 제공하거나 보증하는 것이 아닙니다. 자세한 내용은 이용 약관을 참조하세요.
오픈 소스 스크립트
트레이딩뷰의 진정한 정신에 따라, 이 스크립트의 작성자는 이를 오픈소스로 공개하여 트레이더들이 기능을 검토하고 검증할 수 있도록 했습니다. 작성자에게 찬사를 보냅니다! 이 코드는 무료로 사용할 수 있지만, 코드를 재게시하는 경우 하우스 룰이 적용된다는 점을 기억하세요.
면책사항
해당 정보와 게시물은 금융, 투자, 트레이딩 또는 기타 유형의 조언이나 권장 사항으로 간주되지 않으며, 트레이딩뷰에서 제공하거나 보증하는 것이 아닙니다. 자세한 내용은 이용 약관을 참조하세요.