INVITE-ONLY SCRIPT
업데이트됨 Summit Line
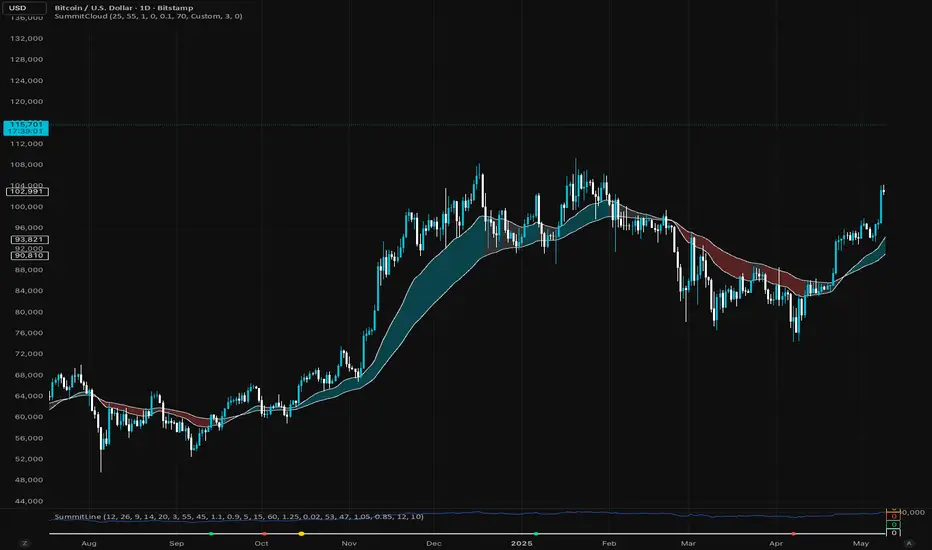
The Summit Line is an advanced momentum and confluence indicator designed to simplify complex market data into clean, actionable dot signals.
It blends MACD, RSI, moving averages and Volume Strength, giving traders a real time gauge of momentum shifts and exhaustion points.
🟢 Green Dot: Bullish confluence
🔴 Red Dot: Bearish confluence
🟡 Gold Dot: “A+” setup, rare alignment of all core metrics, typically at high-probability reversal or breakout zones.
Unlike noisy indicators, Summit Line filters weak signals using RSI slope, volume surges, and EMA trend structure, keeping the chart clean and accurate.
Every dot is pinned along a flat zero baseline for visual simplicity, ideal for combining with the Summit cloud or other price overlays.
릴리즈 노트
The Summit Line is an advanced momentum and confluence indicator designed to simplify complex market data into clean, actionable dot signals.It blends MACD, RSI, moving averages and Volume Strength, giving traders a real time gauge of momentum shifts and exhaustion points.
🟢 Green Dot: Bullish confluence
🔴 Red Dot: Bearish confluence
🟡 Gold Dot: “A+” setup, rare alignment of all core metrics, typically at high-probability reversal or breakout zones.
Unlike noisy indicators, Summit Line filters weak signals using RSI slope, volume surges, and EMA trend structure, keeping the chart clean and accurate.
Every dot is pinned along a flat zero baseline for visual simplicity, ideal for combining with the Summit cloud or other price overlays.
초대 전용 스크립트
이 스크립트는 작성자가 승인한 사용자만 접근할 수 있습니다. 사용하려면 요청 후 승인을 받아야 하며, 일반적으로 결제 후에 허가가 부여됩니다. 자세한 내용은 아래 작성자의 안내를 따르거나 jedhucker에게 직접 문의하세요.
트레이딩뷰는 스크립트의 작동 방식을 충분히 이해하고 작성자를 완전히 신뢰하지 않는 이상, 해당 스크립트에 비용을 지불하거나 사용하는 것을 권장하지 않습니다. 커뮤니티 스크립트에서 무료 오픈소스 대안을 찾아보실 수도 있습니다.
작성자 지시 사항
Welcome to the summit line, a advanced momentum and confluence indicator designed to simplify complex market data into clean, actionable dot signals.
Join the discord for access.
https://whop.com/crypto-summit-club/
면책사항
해당 정보와 게시물은 금융, 투자, 트레이딩 또는 기타 유형의 조언이나 권장 사항으로 간주되지 않으며, 트레이딩뷰에서 제공하거나 보증하는 것이 아닙니다. 자세한 내용은 이용 약관을 참조하세요.