OPEN-SOURCE SCRIPT
업데이트됨 United HUN City
Purpose and Usage
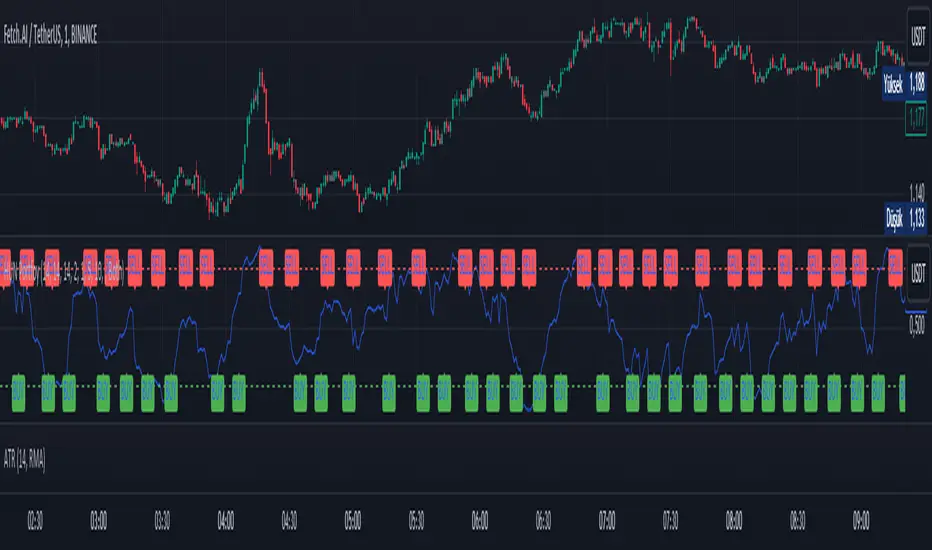
The purpose of this strategy is to create a composite indicator that combines the signals from the MFI, Fisher Transform, and Bollinger Bands %b indicators. By normalizing and averaging these indicators, the script aims to provide a smoother and more comprehensive signal that can be used to make trading decisions.
MFI (Money Flow Index): Measures buying and selling pressure based on price and volume.
Fisher Transform: Highlights potential reversal points by transforming price data to a Gaussian normal distribution.
Bollinger Bands %b: Indicates where the price is relative to the Bollinger Bands, helping to identify overbought or oversold conditions.
The combined indicator can be used to identify potential buy or sell signals based on the smoothed composite value. For instance, a high combined indicator value might indicate overbought conditions, while a low value might indicate oversold conditions.
릴리즈 노트
Purpose and UsageThe purpose of this strategy is to create a composite indicator that combines the signals from the MFI, Fisher Transform, and Bollinger Bands %b indicators. By normalizing and averaging these indicators, the script aims to provide a smoother and more comprehensive signal that can be used to make trading decisions.
MFI (Money Flow Index): Measures buying and selling pressure based on price and volume.
Fisher Transform: Highlights potential reversal points by transforming price data to a Gaussian normal distribution.
Bollinger Bands %b: Indicates where the price is relative to the Bollinger Bands, helping to identify overbought or oversold conditions.
The combined indicator can be used to identify potential buy or sell signals based on the smoothed composite value. For instance, a high combined indicator value might indicate overbought conditions, while a low value might indicate oversold conditions.
2 saat önce
Sürüm Notları:
Purpose and Usage
The purpose of this strategy is to create a composite indicator that combines the signals from the MFI, Fisher Transform, and Bollinger Bands %b indicators. By normalizing and averaging these indicators, the script aims to provide a smoother and more comprehensive signal that can be used to make trading decisions.
MFI (Money Flow Index): Measures buying and selling pressure based on price and volume.
Fisher Transform: Highlights potential reversal points by transforming price data to a Gaussian normal distribution.
Bollinger Bands %b: Indicates where the price is relative to the Bollinger Bands, helping to identify overbought or oversold conditions.
The combined indicator can be used to identify potential buy or sell signals based on the smoothed composite value. For instance, a high combined indicator value might indicate overbought conditions, while a low value might indicate oversold conditions.
v2 Notes:
-Buy and Sell Signals Added:
Buy and sell signals are now integrated into the script.
-Band Levels Added:
Horizontal reference lines (bands) at specific levels are included.
-Minimum Number of Bars Between Buy and Sell Signals Added:
A user-defined input for the minimum number of bars between buy and sell signals is implemented.
-HUN Portfoy Percentage Change Added:
The percentage change calculation for the HUN Portfoy combined indicator is included.
릴리즈 노트
Added timeframe change on the chart.릴리즈 노트
V3 Updates릴리즈 노트
v3.1오픈 소스 스크립트
트레이딩뷰의 진정한 정신에 따라, 이 스크립트의 작성자는 이를 오픈소스로 공개하여 트레이더들이 기능을 검토하고 검증할 수 있도록 했습니다. 작성자에게 찬사를 보냅니다! 이 코드는 무료로 사용할 수 있지만, 코드를 재게시하는 경우 하우스 룰이 적용된다는 점을 기억하세요.
면책사항
해당 정보와 게시물은 금융, 투자, 트레이딩 또는 기타 유형의 조언이나 권장 사항으로 간주되지 않으며, 트레이딩뷰에서 제공하거나 보증하는 것이 아닙니다. 자세한 내용은 이용 약관을 참조하세요.
오픈 소스 스크립트
트레이딩뷰의 진정한 정신에 따라, 이 스크립트의 작성자는 이를 오픈소스로 공개하여 트레이더들이 기능을 검토하고 검증할 수 있도록 했습니다. 작성자에게 찬사를 보냅니다! 이 코드는 무료로 사용할 수 있지만, 코드를 재게시하는 경우 하우스 룰이 적용된다는 점을 기억하세요.
면책사항
해당 정보와 게시물은 금융, 투자, 트레이딩 또는 기타 유형의 조언이나 권장 사항으로 간주되지 않으며, 트레이딩뷰에서 제공하거나 보증하는 것이 아닙니다. 자세한 내용은 이용 약관을 참조하세요.