OPEN-SOURCE SCRIPT
업데이트됨 RSI Triple Time Frame

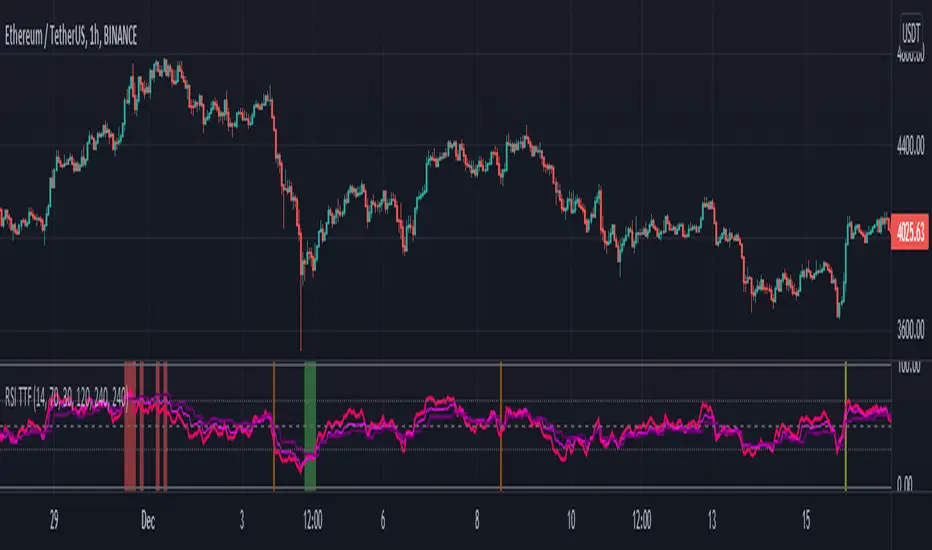
This indicator / study script can display the RSI for current chart timeframe along with the RSI of 1 to 3 other timeframes.
When all 3 additional RSI are at extreme levels (overbought/sold) or crossing the neutral line (50%) at the same moment, background chart color will change accordingly.
This indicates a strong momentum convergence between all selected timeframes, hence producing a stronger signal!
Go to settings to display/modify additional timeframes and/or to enable background colors:
Green = Overbought
Red = Oversold
Yellow = crossover neutral
Orange = crossunder neutral
NB1: For a simple and easy read of the RSI, set all additional TF to current chart TF and switch on desired colors.
NB2: Please note that current chart TF is not taken into consideration to change background color. But you can always set one of the 3 additional TF to the same TF as current chart.
Bonus: If you are also a user of my “MA Bollinger Bands + RSI” strategy script, this is particularly useful to visually detect crossover and crossunder of the RSI neutral line 😉
As always, enjoy!
릴리즈 노트
Neutral Line, previsouly hard coded at 50, now has it's own user input.릴리즈 노트
- [Upadted to Pine V5]
[Color changes between possible max & min values]
[Cleaner input settings]
릴리즈 노트
- Upadted to Pine V5
- Color changes between possible max & min values
- Cleaner input settings
릴리즈 노트
V5- Fixed the 3 "Higher Time Frame RSIs" repainting issues.
오픈 소스 스크립트
트레이딩뷰의 진정한 정신에 따라, 이 스크립트의 작성자는 이를 오픈소스로 공개하여 트레이더들이 기능을 검토하고 검증할 수 있도록 했습니다. 작성자에게 찬사를 보냅니다! 이 코드는 무료로 사용할 수 있지만, 코드를 재게시하는 경우 하우스 룰이 적용된다는 점을 기억하세요.
면책사항
해당 정보와 게시물은 금융, 투자, 트레이딩 또는 기타 유형의 조언이나 권장 사항으로 간주되지 않으며, 트레이딩뷰에서 제공하거나 보증하는 것이 아닙니다. 자세한 내용은 이용 약관을 참조하세요.
오픈 소스 스크립트
트레이딩뷰의 진정한 정신에 따라, 이 스크립트의 작성자는 이를 오픈소스로 공개하여 트레이더들이 기능을 검토하고 검증할 수 있도록 했습니다. 작성자에게 찬사를 보냅니다! 이 코드는 무료로 사용할 수 있지만, 코드를 재게시하는 경우 하우스 룰이 적용된다는 점을 기억하세요.
면책사항
해당 정보와 게시물은 금융, 투자, 트레이딩 또는 기타 유형의 조언이나 권장 사항으로 간주되지 않으며, 트레이딩뷰에서 제공하거나 보증하는 것이 아닙니다. 자세한 내용은 이용 약관을 참조하세요.