OPEN-SOURCE SCRIPT
LV Stock Quality
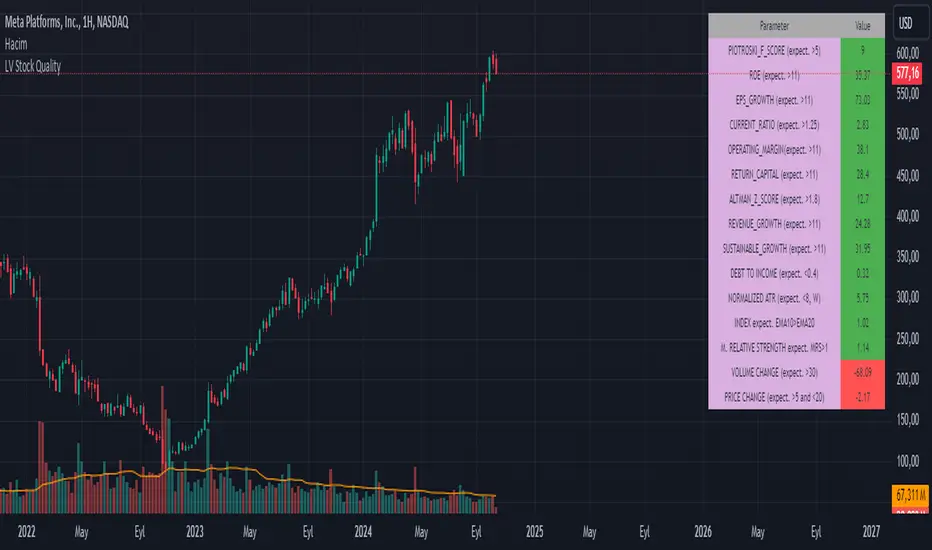
Critical financial and technical values are listed in the table.
PIOTROSKI_F_SCORE (expect. >5) -> The Piotroski score is a discrete score between zero and nine that reflects nine criteria used to determine the strength of a firm's financial position. The Piotroski score is used to determine the best value stocks, with nine being the best and zero being the worst. Having a score bigger than 5 is a good sign for the strength of a firm's financial position
ROE (expect. >11) --> Return on equity (ROE) is a measure of a company's financial performance. It is calculated by dividing net income by shareholders' equity. Because shareholders' equity is equal to a company’s assets minus its debt, ROE is a way of showing a company's return on net assets. A “good” ROE will depend on the company’s industry and competitors.
EPS_GROWTH (expect. >11) --> This indicator is calculated as the percentage change in Basic earnings per share for one year. This indicator reflects the growth rate of a company's basic profit per share outstanding for one year. It is calculated based using only common shares. An increase in EPS growth may signal that a company is becoming more profitable and efficient in its operations. A decline in EPS growth may signal that a company is spending more or losing business share. EPS growth should be viewed alongside other metrics like revenue and costs.
CURRENT_RATIO (expect. >1.25) --> The current ratio measures a company’s ability to pay current, or short-term, liabilities (debt and payables) with its current, or short-term, assets (cash, inventory, and receivables). Current ratios over 1.00 indicate that a company's current assets are greater than its current liabilities, meaning it could more easily pay of short-term debts.
OPERATING_MARGIN(expect. >11) --> The operating margin measures how much profit a company makes on a dollar of sales after paying for variable costs of production, such as wages and raw materials, but before paying interest or tax.
RETURN_CAPITAL (expect. >11) --> Return of capital (ROC) is a payment that an investor receives as a portion of their original investment and that is not considered income or capital gains from the investment.
ALTMAN_Z_SCORE (expect. >1.8) --> The Altman Z-score is the output of a credit-strength test that gauges a publicly traded manufacturing company's likelihood of bankruptcy. An Altman Z-score close to 0 suggests a company might be headed for bankruptcy, while a score closer to 3 suggests a company is in solid financial positioning.
REVENUE_GROWTH (expect. >11) --> Quarterly revenue growth is an increase in a company's sales in one quarter compared to sales of a different quarter. Comparing a company's financials from one period to another gives a clear picture of its revenue growth rate and can help investors identify the catalyst for such growth.
SUSTAINABLE_GROWTH (expect. >11) --> The sustainable growth rate (SGR) is the maximum rate of growth that a company or social enterprise can sustain without having to finance growth with additional equity or debt. In other words, it is the rate at which the company can grow while using its own internal revenue without borrowing from outside sources.
DEBT TO INCOME (expect. <0.4) --> A debt-to-income (DTI) ratio is a financial metric used by lenders to determine your borrowing risk. Your DTI ratio represents the total amount of debt you owe compared to the total amount of money you earn each month.
NORMALIZED ATR (expect. <8, W) --> The Normalized Average True Range (Normalized ATR) is an indicator used to measure market volatility by normalizing the average true range values. It does this by dividing the Average True Range (ATR) by the asset's closing price, converting it into a percentage. This normalization allows for the comparison of volatility levels across different securities or market conditions, regardless of the asset's price levels. The Normalized ATR helps traders to adjust their strategies based on relative volatility, rather than absolute price movements.
INDEX expect. EMA10>EMA20 --> it is expected to have EMA 10 > EMA 20 in weekly basis graph. It is known that having a strong trend in index will also increases chance of strong trend on stock levels. You need to select INDEX Market of stock via settings.
M. RELATIVE STRENGTH expect. MRS>1 --> Stan Weinstein uses the Mansfield RS indicator as another relative strength indicator. The indicator measures the variation in the 52-week ratio of stock and market.
VOLUME CHANGE (expect. >30) --> Having an increase on volume comparing to previous week can be a good sign if it occurs at the same time of breakout.
PRICE CHANGE (expect. >5 and <20) --> Having an increase on price comparing to previous week can be a good sign if it occurs at the same time of breakout.
It is better to look on weekly basis graphs.
오픈 소스 스크립트
트레이딩뷰의 진정한 정신에 따라, 이 스크립트의 작성자는 이를 오픈소스로 공개하여 트레이더들이 기능을 검토하고 검증할 수 있도록 했습니다. 작성자에게 찬사를 보냅니다! 이 코드는 무료로 사용할 수 있지만, 코드를 재게시하는 경우 하우스 룰이 적용된다는 점을 기억하세요.
면책사항
해당 정보와 게시물은 금융, 투자, 트레이딩 또는 기타 유형의 조언이나 권장 사항으로 간주되지 않으며, 트레이딩뷰에서 제공하거나 보증하는 것이 아닙니다. 자세한 내용은 이용 약관을 참조하세요.
오픈 소스 스크립트
트레이딩뷰의 진정한 정신에 따라, 이 스크립트의 작성자는 이를 오픈소스로 공개하여 트레이더들이 기능을 검토하고 검증할 수 있도록 했습니다. 작성자에게 찬사를 보냅니다! 이 코드는 무료로 사용할 수 있지만, 코드를 재게시하는 경우 하우스 룰이 적용된다는 점을 기억하세요.
면책사항
해당 정보와 게시물은 금융, 투자, 트레이딩 또는 기타 유형의 조언이나 권장 사항으로 간주되지 않으며, 트레이딩뷰에서 제공하거나 보증하는 것이 아닙니다. 자세한 내용은 이용 약관을 참조하세요.