OPEN-SOURCE SCRIPT
Price vs 10/50DMA (%) — single label
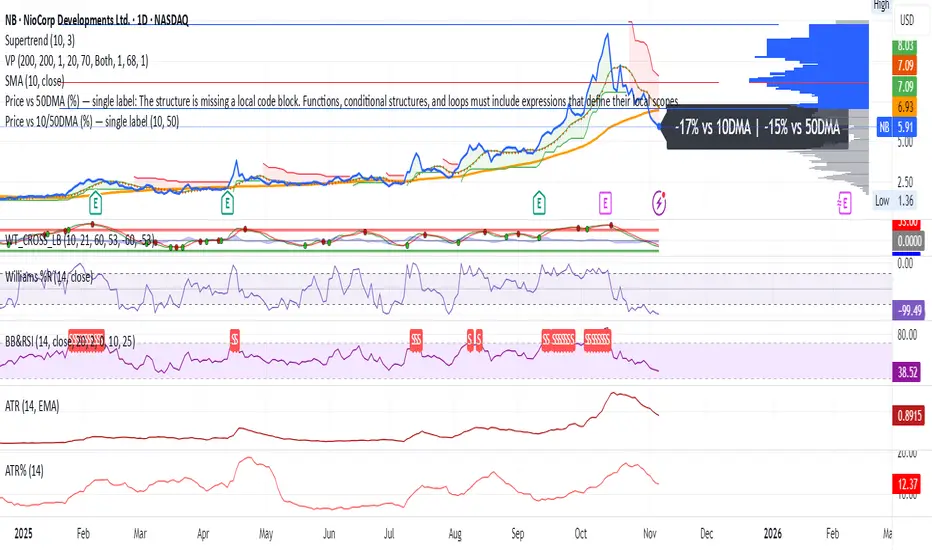
This TradingView script shows how far the current price is from its 10-day and 50-day moving averages (DMAs), expressed as percentages, and displays both values as a single label near the latest candle — for example, “+3% vs 10DMA | +8% vs 50DMA.” You can switch between simple and exponential moving averages using the “Use EMA” checkbox, and adjust the period lengths in the input panel. To use it, simply copy the code into TradingView’s Pine Editor, click Add to chart, and you’ll see one live label updating each bar along with the plotted 10- and 50-day average lines.
오픈 소스 스크립트
트레이딩뷰의 진정한 정신에 따라, 이 스크립트의 작성자는 이를 오픈소스로 공개하여 트레이더들이 기능을 검토하고 검증할 수 있도록 했습니다. 작성자에게 찬사를 보냅니다! 이 코드는 무료로 사용할 수 있지만, 코드를 재게시하는 경우 하우스 룰이 적용된다는 점을 기억하세요.
Ex-Fidelity analyst.
Love markets.
Love markets.
면책사항
해당 정보와 게시물은 금융, 투자, 트레이딩 또는 기타 유형의 조언이나 권장 사항으로 간주되지 않으며, 트레이딩뷰에서 제공하거나 보증하는 것이 아닙니다. 자세한 내용은 이용 약관을 참조하세요.